
Concept explainers
Interpretation: The control over production process is to be assessed using the
Concept Introduction:
Answer to Problem 2CSQD
The mean and range values are well within the control limits as seen from the x bar and R charts. Hence, the production process is in control.
Explanation of Solution
Given information:
 The
The
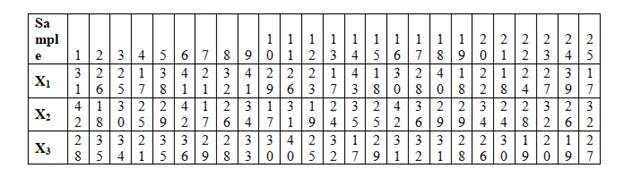
The sample mean and range are calculated and shown below:
| Sample | X1 | X2 | X3 | Sample mean(X1+X2+X3)/3 | Sample Range |
| 1 | 31 | 42 | 28 | 33.67 {(31+42+28)/3=33.67} | 14 |
| 2 | 26 | 18 | 35 | 26.33 | 17 |
| 3 | 25 | 30 | 34 | 29.67 | 9 |
| 4 | 17 | 25 | 21 | 21.00 | 8 |
| 5 | 38 | 29 | 35 | 34.00 | 9 |
| 6 | 41 | 42 | 36 | 39.67 | 6 |
| 7 | 21 | 17 | 29 | 22.33 | 12 |
| 8 | 32 | 26 | 28 | 28.67 | 6 |
| 9 | 41 | 34 | 33 | 36.00 | 8 |
| 10 | 29 | 17 | 30 | 25.33 | 13 |
| 11 | 26 | 31 | 40 | 32.33 | 14 |
| 12 | 23 | 19 | 25 | 22.33 | 6 |
| 13 | 17 | 24 | 32 | 24.33 | 15 |
| 14 | 43 | 35 | 17 | 31.67 | 26 |
| 15 | 18 | 25 | 29 | 24.00 | 11 |
| 16 | 30 | 42 | 31 | 34.33 | 12 |
| 17 | 28 | 36 | 32 | 32.00 | 8 |
| 18 | 40 | 29 | 31 | 33.33 | 11 |
| 19 | 18 | 29 | 28 | 25.00 | 11 |
| 20 | 22 | 34 | 26 | 27.33 | 12 |
| 21 | 18 | 24 | 30 | 24.00 | 12 |
| 22 | 24 | 28 | 19 | 23.67 | 9 |
| 23 | 27 | 32 | 20 | 26.33 | 12 |
| 24 | 39 | 26 | 19 | 28.00 | 20 |
| 25 | 17 | 32 | 27 | 25.33 | 15 |
| Total | 710.67 | 296 | |||
| Average | 28.43 | 11.84 |
From the 3-sigma standard control chart, the coefficient values are obtained as follows:
And the control limits are calculated
The
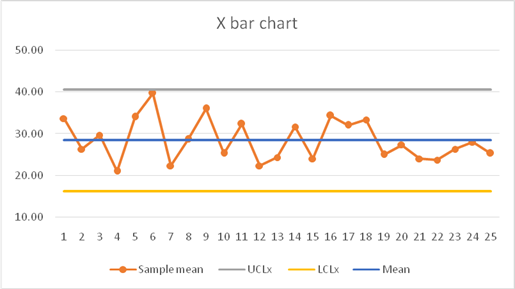
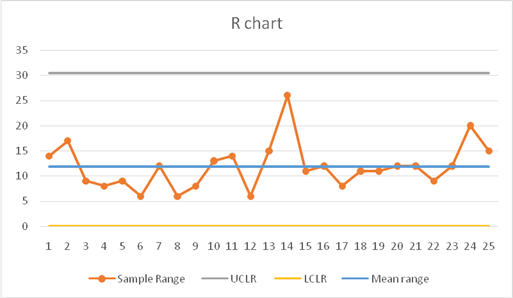
The mean and range values are well within the control limits and hence the process is in control.
Want to see more full solutions like this?
Chapter 16 Solutions
OM6 ONLINE-LMS INTEGRATED ACCESS


- In the following problems assume, unless otherwise stated, that S = $40, σ = 30%, r =8%,and δ =0. 13.1 Suppose you sell a 45-strike call with 91 days to expiration. What is delta? If the option is on 100 shares, what investment is required for a delta-hedged portfolio? What is your overnight profit if the stock tomorrow is $39? What if the stock price is $40.50?arrow_forwardQuestion 1 M&H company ltd. sells television sets and has collected monthly sales data (in units) for the past 12 months as shown in table 1below: TABLE 1 Month Sales (Units) 1 120 2 135 3 150 4 165 5 180 6 200 7 195 8 210 9 225 10 240 11 255 12 270 Using the data provided, answer the following questions: a. Using a 3-month weighted moving average with weights 0.5, 0.3, and 0.2 (most recent month having the highest weight), calculate the forecast for month 13. [2 marks] b. If the company applies an exponential smoothing method with a smoothing constant (a) = 02, and assumes an initial forecast of 120 units for Month 1, calculate the forecast for month 13. [6 marks] c. Calculate the Mean Absolute Deviation (MAD) for the exponential smoothing method and weighted moving average method using the actual sales data for Months 4 to 12 and determine which method is more accurate. [8 marks] d. Compute the values of a (intercept) and b (slope) using the least squares method. [7 marks] e. Use the…arrow_forwardQuestion 4 MGM12026 Production and Operations Management semester il 2024 A company operates a manufacturing plant that produces two products, A and B. The plant has the following capacity data: . . Design Capacity: 15,000 machine hours per month Effective Capacity: 12,000 machine hours per month Actual Output (Utilized Capacity): 10,000 machine hours per month Additionally, the plant produces Product A and Product B, with the following production data: Product Demand (Units) Processing Time Contribution Margin ($ (hours per unit) per unit) A 3,000 2.5 40 B 4,000 1.5 30 a. Calculate the plant's i. Capacity Utilization [3 marks] ii. Effective Capacity Utilization [3 marks] iii. Efficiency. Interpret the results. [3 marks] b. Compute the total machine hours required to meet full demand for both products. [5 marks] c. Determine whether the plant has sufficient capacity to meet full demand. If not, calculate the shortfall in machine hours. [3 marks] d. Using the contribution margin per…arrow_forward
- Question 3 i. Using the Center of Gravity method, determine the optimal location (X, Y) for the new distribution center. [7 marks] [TOTAL 25 MARKS] Time (sec.) Power steering assembly firm wants to set up an assembly line which must have an output of 60 units per hour. The work elements, task times and their precedence relationships are shown in Table 2: Table 1 Work Element Immediate Predecessor(s) A 30 NONE B 26 A C 50 A D 44 B E 10 с F 20 с G 15 D.E H 30 E,G,F Required: a. Draw the precedence diagram showing the task precedence and their times b. Determine the cycle time associated with the rate of output required. [3 marks] c. What is the theoretical number of work stations required to satisfy this output rate? [3 marks] [4 marks] d. Allocate the tasks to work stations taking into consideration the precedence requirements and using the LOT rule to break ties between feasible tasks. e. Calculate the total idle time [8 marks] [3 marks] f. What is the efficiency of the line and the…arrow_forwardQuestion 2 MGMT2026 Production and Operations Management Semester II 2024-2025 a. Aman ltd. desires to locate a new facility. Based on preliminary analysis, the choice has been reduced to four locations: A, B, C, and D. These four locations were rated on a scale from 1 (worst) to 10 (best) on each of four criteria. Each criterion was also weighted to indicate its importance (i.e., the higher the weight, the more important). The list of ratings and weights follows in the Table 2 below: Table 2 Factor Score Evaluation by Location Criterion Weights A B с D Wages 25 4 5 3 4 Government Policies 30 8 7 6 5 Unionisation Weather 15 6 4 3 2 30 3 4 6 5 i. Based on weighted scores, where should Acme locate its new facility? [6 marks] b. An operations manager has narrowed down the search for a new factory to three locations. The fixed and variable costs associated with each location is given in the table below. i. Table 3 Location Fixed Cost Variable Cost A $100,000 $10 B $150,000 $7 с $200,000 $5…arrow_forwardThe University of the West Indies GLOBAL CAMPUS MGMT 2026 Production and Operations Management - Problem Sheet Assignment Semester II 2024/2025 Note: Although this assignment is being currently assessed out of 100 marks it would be prorated to Contribute a maximum of 40% towards your final course marks. M&H company ltd. sells television sets and has collected monthly sales data (in units) for the past 12 months as shown in table 1below: TABLE 1 Month Sales (Units) 1 120 2 135 3 150 165 5 180 200 7 195 8 210 225 10 240 11 255 12 270 This Assignment is comprised of four (4) Questions - All questions must be attempted Using the data provided, answer the following questions: a. Using a 3-month weighted moving average with weights 0.5, 0.3, and 0.2 (most recent month having the highest weight), calculate the forecast for month 13. [2 marks] Screens 5-7 of 7arrow_forward
- Gas sales across type: 80% of gas sales tend to be regular. 15% midgrade, 5% tend to be premium. $0.10 increase in price per gallon tends to decrease gallons sold by 1 to 3%. Jan-0.87, Feb-0.95, Mar-1.00, Apr-1.05, May-1.08, Jun1.15, Jul-1.13, Aug-1.07, Sep-1.02, Oct-0.94, Nov-0.89, Dec-0.85. You want the MAPE to be below 20%, if ypu can get it to or below 10% they'll throw in extra $10k. Wont get bonus if it is above 11% or 20%. It cannot be over 20%.arrow_forwardhelp me choose the correct path please. There are other optionsarrow_forwardNegotiators can gain several benefits from using the strategy of multiple equivalent simultaneous offers. By offering multiple options it reduces the chance of rejection. It also improves the chances of reaching reaching an agreement. By presenting multiple offers, it shows you are flexible. agree with the postarrow_forward
- Negotiators can gain several benefits from using the strategy of multiple equivalent simultaneous offers. By offering multiple options it reduces the chance of rejection. It also improves the chances of reaching reaching an agreement. By presenting multiple offers, it shows you are flexible. disagree with this post or add on to the postarrow_forwardThe strategy of Multiple Equivalent Simultaneous Offers involves presenting several equally valuable options to the other party during negotiations. This approach benefits negotiators by creating flexibility and increasing the chances of finding a mutually agreeable solution. By offering multiple options, negotiators show that they are open to compromise, which can build trust and make the negotiation process smoother. It also helps avoid getting stuck on one issue, as the other party can choose from several alternatives that meet their needs. In my experience, using MESOs in a work negotiation helped both parties reach an agreement more quickly because each option was carefully thought out to address different needs, and this made it easier for us to settle on one that worked for both sides. This strategy can also reveal what is most important to the other party, helping negotiators understand their priorities better. agree or disagree with the postarrow_forwardExamine the conflicts between improving customer service levels and controlling costs in sales. Strategies to Balance Both customer service levels and controlling costs in sales 1.Outsourcing and workforce optimization 2. AI-driven customer supportarrow_forward
 Foundations of Business - Standalone book (MindTa...MarketingISBN:9781285193946Author:William M. Pride, Robert J. Hughes, Jack R. KapoorPublisher:Cengage Learning
 Foundations of Business (MindTap Course List)MarketingISBN:9781337386920Author:William M. Pride, Robert J. Hughes, Jack R. KapoorPublisher:Cengage Learning
 Practical Management ScienceOperations ManagementISBN:9781337406659Author:WINSTON, Wayne L.Publisher:Cengage,