
Videos
B. Thomas Testing Labs
John Thomas, the owner of Thomas Testing, has for some time done contract work for insurance companies regarding drunk driving. To improve his research capabilities, he recently purchased the Rupple Driving Simulator. This device will allow a subject to take a “road test” and provide a score indicating the number of driving errors committed during the test drive. Higher scores indicate more driving errors. Driving errors would include not coming to a complete stop at a stop sign, not using turning signals, not exercising caution on wet or snowy pavement, and so on. During the road test, problems appear at random and not all problems appear in each road test. These are major advantages to the Rupple Driving Simulator because subjects do not gain any advantage by taking the test several times.
With the new driving simulator, Mr. Thomas would like to study in detail the problem of drunk driving. He begins by selecting a random sample of 25 drivers. He asks each of the selected individuals to take the test drive on the Rupple Driving Simulator. The number of errors for each driver is recorded. Next, he has each of the individuals in the group drink three 16-ounce cans of beer in a 60-minute period and return to the Rupple Driving Simulator for another test drive. The number of driving errors after drinking the beer is also shown. The research question is: Does alcohol impair the driver’s ability and, therefore, increase the number of driving errors?
Mr. Thomas believes the distribution of scores on the test drive does not follow a
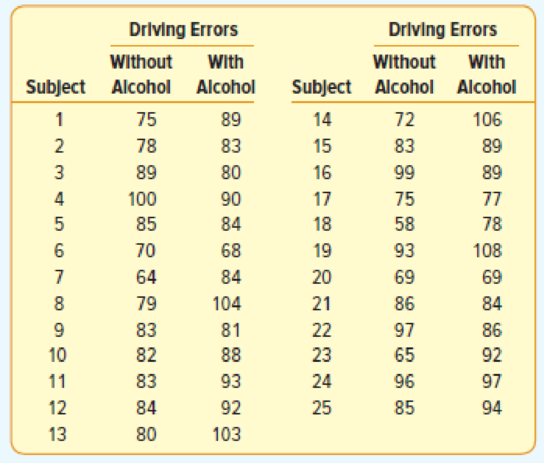
- a. Compare the results using these two procedures. Conduct an appropriate test of hypothesis to determine if alcohol is related to driving errors.
- b. Write a report that summarizes your findings.
Want to see the full answer?
Check out a sample textbook solution
Chapter 16 Solutions
Loose Leaf for Statistical Techniques in Business and Economics


- Times to complete a statistics exam have a normal distribution with a mean of 40 minutes and standard deviation of 6 minutes. Deshawn's time comes in at the 90th percentile. What percentage of the students are still working on their exams when Deshawn leaves?arrow_forwardSuppose that the weights of cereal boxes have a normal distribution with a mean of 20 ounces and standard deviation of half an ounce. A box that has a standard score of o weighs how much? syed by ilog ni 21arrow_forwardBob scores 80 on both his math exam (which has a mean of 70 and standard deviation of 10) and his English exam (which has a mean of 85 and standard deviation of 5). Find and interpret Bob's Z-scores on both exams to let him know which exam (if either) he did bet- ter on. Don't, however, let his parents know; let them think he's just as good at both subjects. algas 70) sering digarrow_forward
- Sue's math class exam has a mean of 70 with a standard deviation of 5. Her standard score is-2. What's her original exam score?arrow_forwardClint sleeps an average of 8 hours per night with a standard deviation of 15 minutes. What's the chance he will sleep less than 7.5 hours tonight? nut bow visarrow_forwardSuppose that your score on an exam is directly at the mean. What's your standard score?arrow_forward
- One state's annual rainfall has a normal dis- tribution with a mean of 100 inches and standard deviation of 25 inches. Suppose that corn grows best when the annual rainfall is between 100 and 150 inches. What's the chance of achieving this amount of rainfall? wved now of sociarrow_forward13 Suppose that your exam score has a standard score of 0.90. Does this mean that 90 percent of the other exam scores are lower than yours?arrow_forwardBob's commuting times to work have a nor- mal distribution with a mean of 45 minutes and standard deviation of 10 minutes. How often does Bob get to work in 30 to 45 minutes?arrow_forward
- Bob's commuting times to work have a nor- mal distribution with a mean of 45 minutes and standard deviation of 10 minutes. a. What percentage of the time does Bob get to work in 30 minutes or less? b. Bob's workday starts at 9 a.m. If he leaves at 8 a.m., how often is he late?arrow_forwardSuppose that you want to put fat Fido on a weight-loss program. Before the program, his weight had a standard score of +2 com- pared to dogs of his breed/age, and after the program, his weight has a standard score of -2. His weight before the program was 150 pounds, and the standard deviation for the breed is 5 pounds. a. What's the mean weight for Fido's breed/ age? b. What's his weight after the weight-loss program?arrow_forwardWeights have a normal distribution with a mean of 100 and standard deviation of 10. What weight has 60 percent of the values lying below it?arrow_forward
 Glencoe Algebra 1, Student Edition, 9780079039897...AlgebraISBN:9780079039897Author:CarterPublisher:McGraw Hill
 Holt Mcdougal Larson Pre-algebra: Student Edition...AlgebraISBN:9780547587776Author:HOLT MCDOUGALPublisher:HOLT MCDOUGAL
 Big Ideas Math A Bridge To Success Algebra 1: Stu...AlgebraISBN:9781680331141Author:HOUGHTON MIFFLIN HARCOURTPublisher:Houghton Mifflin Harcourt