
Concept explainers
Videos
a.
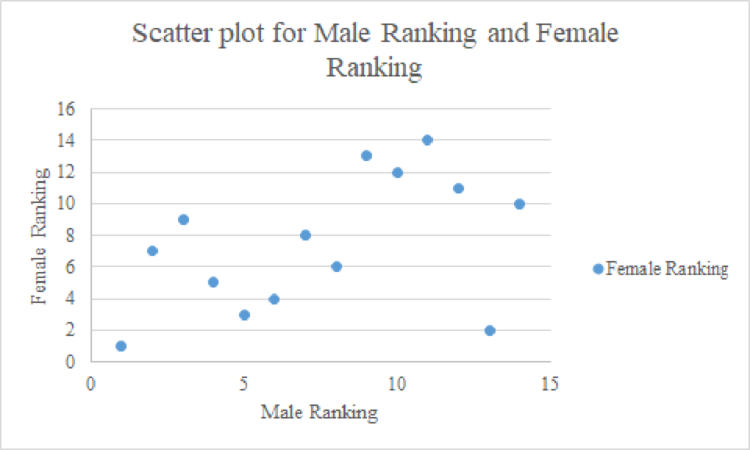
Construct a
a.
Explanation of Solution
The scatter plot for male and female rankings is given below:
Step-by-step procedure to obtain scatter plot using EXCEL:
- Open an EXCEL file.
- In column A, enter the column of Male ranking, in column B enter the column of Female ranking.
- Select the data that is to be displayed.
- Click on Insert > select Scatter icon.
- Click on the chart > select Layout from the Chart Tools.
- Select Chart Title > Above Chart.
- Enter Scatter plot for Male ranking Vs. Female ranking in the dialog box.
- Select Axis Title > Primary Horizontal Axis Title > Title Below Axis.
- Enter Male ranking in the dialog box.
- Select Axis Title > Primary Vertical Axis Title > Rotated Title.
- Enter Female ranking in the dialog box.
Output obtained using EXCEL is given below:
b.
Obtain the coefficient of rank
b.
Answer to Problem 25E
The coefficient of rank correlation between male and female rankings is 0.468.
Explanation of Solution
Where, d is the difference between ranks of each pair.
n is the number of paired observations.
The table represents the difference between ranks of each pair:
|
(1) Program |
(2) Male ranking |
(3) Female ranking |
(4) Rank 1 |
(5) Rank 2 |
(6) Difference, |
(7) |
| 1 | 4 | 5 | 4 | 5 | 1 | |
| 2 | 6 | 4 | 6 | 4 | 4 | |
| 3 | 7 | 8 | 7 | 8 | 1 | |
| 4 | 2 | 7 | 2 | 7 | 25 | |
| 5 | 12 | 11 | 12 | 11 | 1 | |
| 6 | 8 | 6 | 8 | 6 | 4 | |
| 7 | 5 | 3 | 5 | 3 | 4 | |
| 8 | 3 | 9 | 3 | 9 | 36 | |
| 9 | 13 | 2 | 13 | 2 | 121 | |
| 10 | 14 | 10 | 14 | 10 | 16 | |
| 11 | 1 | 1 | 1 | 1 | 0 | |
| 12 | 9 | 13 | 9 | 13 | 16 | |
| 13 | 10 | 12 | 10 | 12 | 4 | |
| 14 | 11 | 14 | 11 | 14 | 9 | |
In this context, the number of paired observation, n is 14.
The Spearman’s coefficient of rank correlation obtained as given below:
Substitute the corresponding values to get the rank correlation.
Thus, the Spearman’s coefficient of rank correlation is 0.468.
The rank correlation value of 0.468 reveals that there is slight positive correlation between male and female rankings.
c.
State whether it can be concluded that there is a positive association between male and female rankings.
c.
Answer to Problem 25E
The conclusion is that, there is no evidence that there is a positive association between male and female rankings.
Explanation of Solution
The test hypothesis is given as follows:
Null hypothesis:
Alternative hypothesis:
In this context, the number of paired observations is 14.
If the
Hypothesis test for rank correlation:
Degrees of freedom:
Decision rule:
- If
- Otherwise fail to reject the null hypothesis.
In this context, the critical value
From Part (a), the rank correlation,
The test statistic will be obtained as given below:
Substitute
Conclusion:
Here, the test statistic is greater than the critical value.
Therefore, by the decision rule, reject the null hypothesis.
Therefore, there is evidence to support the claim that there is a positive association between male and female rankings.
Want to see more full solutions like this?
Chapter 16 Solutions
Loose Leaf for Statistical Techniques in Business and Economics


- Show all workarrow_forwardplease find the answers for the yellows boxes using the information and the picture belowarrow_forwardA marketing agency wants to determine whether different advertising platforms generate significantly different levels of customer engagement. The agency measures the average number of daily clicks on ads for three platforms: Social Media, Search Engines, and Email Campaigns. The agency collects data on daily clicks for each platform over a 10-day period and wants to test whether there is a statistically significant difference in the mean number of daily clicks among these platforms. Conduct ANOVA test. You can provide your answer by inserting a text box and the answer must include: also please provide a step by on getting the answers in excel Null hypothesis, Alternative hypothesis, Show answer (output table/summary table), and Conclusion based on the P value.arrow_forward
- A company found that the daily sales revenue of its flagship product follows a normal distribution with a mean of $4500 and a standard deviation of $450. The company defines a "high-sales day" that is, any day with sales exceeding $4800. please provide a step by step on how to get the answers Q: What percentage of days can the company expect to have "high-sales days" or sales greater than $4800? Q: What is the sales revenue threshold for the bottom 10% of days? (please note that 10% refers to the probability/area under bell curve towards the lower tail of bell curve) Provide answers in the yellow cellsarrow_forwardBusiness Discussarrow_forwardThe following data represent total ventilation measured in liters of air per minute per square meter of body area for two independent (and randomly chosen) samples. Analyze these data using the appropriate non-parametric hypothesis testarrow_forward
 Big Ideas Math A Bridge To Success Algebra 1: Stu...AlgebraISBN:9781680331141Author:HOUGHTON MIFFLIN HARCOURTPublisher:Houghton Mifflin Harcourt
 Glencoe Algebra 1, Student Edition, 9780079039897...AlgebraISBN:9780079039897Author:CarterPublisher:McGraw Hill
 Holt Mcdougal Larson Pre-algebra: Student Edition...AlgebraISBN:9780547587776Author:HOLT MCDOUGALPublisher:HOLT MCDOUGAL