
Concept explainers
Videos
A sample containing years to maturity and yield (%) for 40 corporate bonds is contained in the data file named CorporateBonds (Barron’s, April 2, 2012).
- a. Develop a
scatter diagram of the data using x = years to maturity as the independent variable. Does a simple linear regression model appear to be appropriate? - b. Develop an estimated regression equation with x = years to maturity and x2 as the independent variables.
- c. As an alternative to fitting a second-order model, fit a model using the natural logarithm of price as the independent variable; that is, ŷ = b0 + b1ln(x). Does the estimated regression using the natural logarithm of x provide a better fit than the estimated regression developed in part (b)? Explain.
a.
Construct a scatter diagram of the data using
Decide whether a simple linear regression model appears to be appropriate.
Answer to Problem 29SE
The scatter diagram of the data using
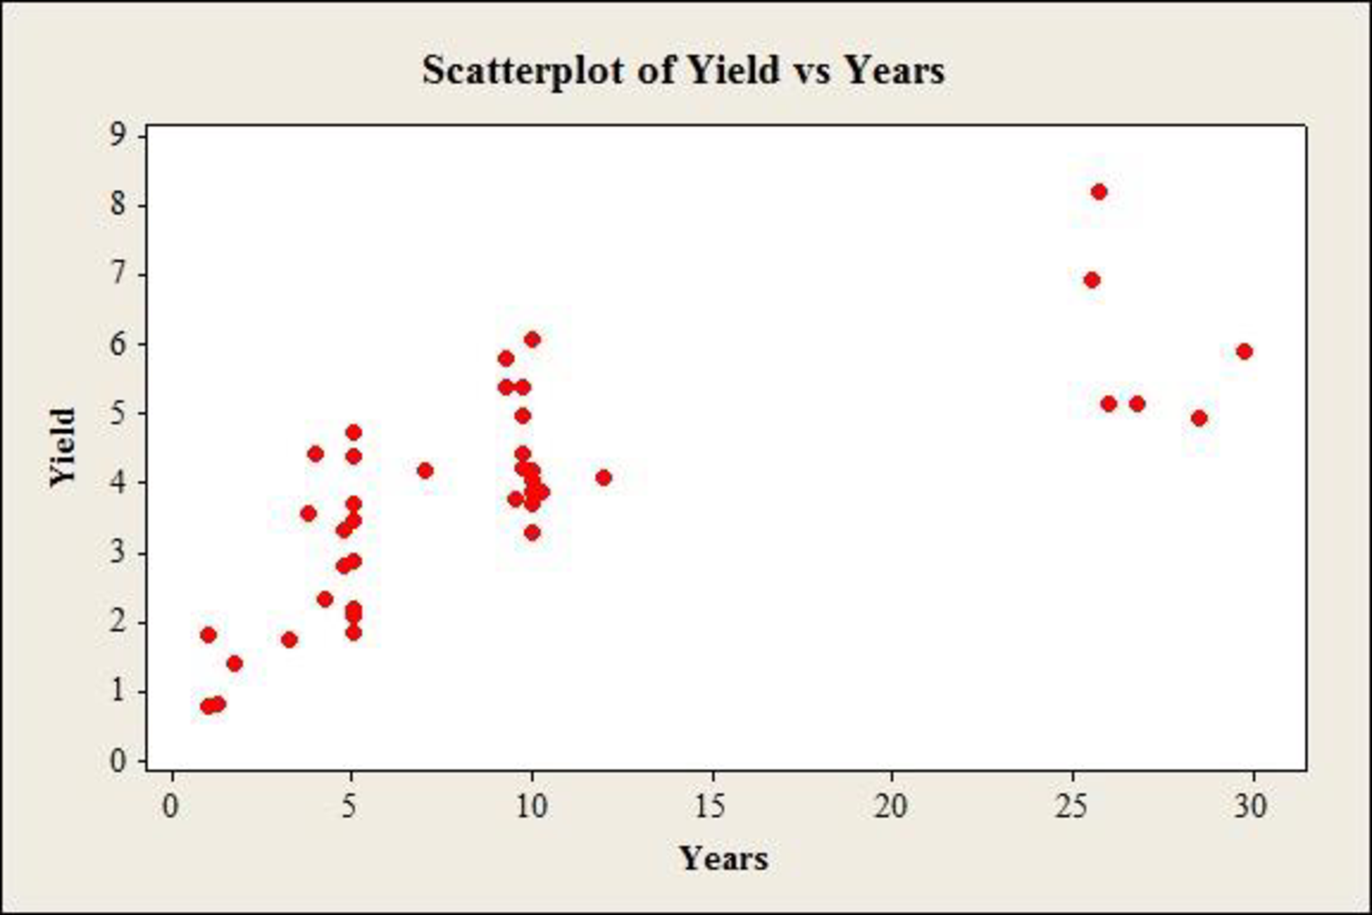
A simple linear regression model does not appear to be appropriate.
Explanation of Solution
Calculation:
The data gives information on yield (%) of 40 corporate bonds and the respective years to maturity.
Scatterplot:
Software procedure:
Step by step procedure to draw scatter diagram using MINITAB software is given below:
- Choose Graph > Scatterplot.
- Choose Simple, and then click OK.
- In Y–variables, enter the column of Yield.
- In X–variables enter the column of Years.
- Click OK.
Observation:
The scatterplot shows a gradual increase in the yield, at a decreasing rate, with increase in years up to 25. After this, there is a reduction in the values of yield. Thus, a simple linear regression model does not appear to be appropriate.
b.
Develop an estimated multiple regression equation with
Answer to Problem 29SE
The estimated multiple regression equation with
Explanation of Solution
Calculation:
Square transformation:
Software procedure:
Step by step procedure to make square transformation using MINITAB software is given as,
- Choose Calc > Calculator.
- In Store result in variable, enter YearsSq.
- In Expression, enter ‘Years’^2.
- Click OK.
The squared variable is stored in the column of ‘YearsSq’.
Regression:
Software procedure:
Step by step procedure to obtain the regression equation using MINITAB software:
- Choose Stat > Regression > General Regression.
- Under Responses, enter the column of Yield.
- Under Model, enter the columns of Years, YearsSq.
- Click OK.
Output using MINITAB software is given below:
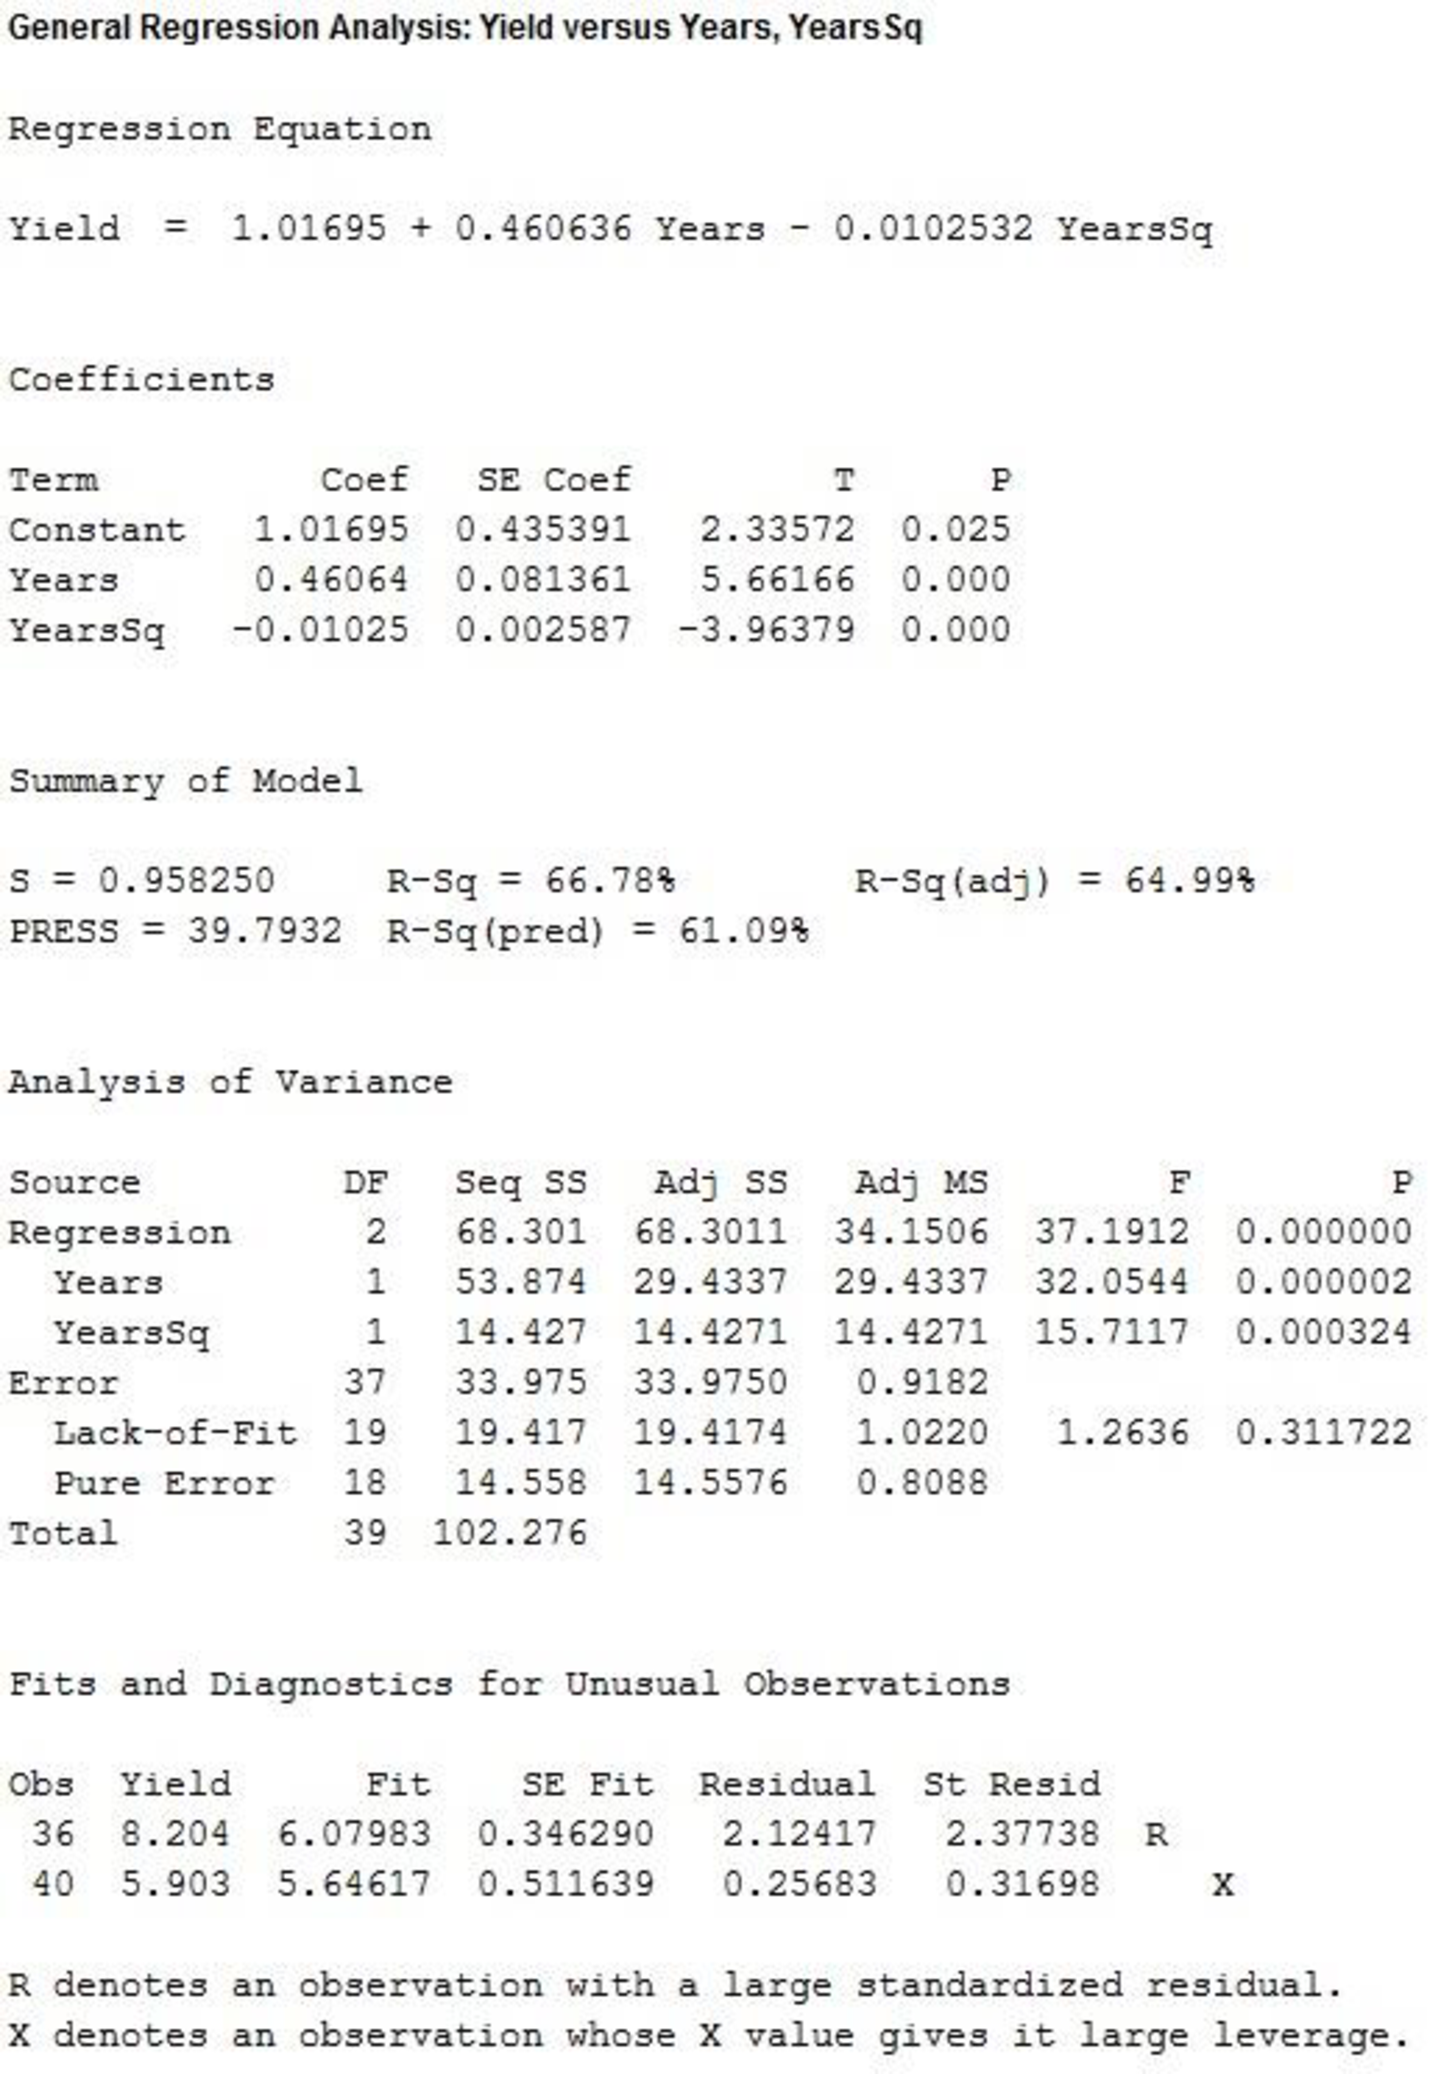
From the output, the estimated multiple regression equation with
c.
Develop an estimated multiple regression equation using the natural logarithm of years as the independent variable.
Explain whether the current regression provides a better fit than the estimated regression developed in part b.
Answer to Problem 29SE
The estimated multiple regression equation using the natural logarithm of years as the independent variable is:
The estimated regression using the natural logarithm of x provides a better fit than the estimated regression developed in part b.
Explanation of Solution
Calculation:
Logarithmic transformation:
Software procedure:
Step by step procedure to make logarithmic transformation using MINITAB software is given as,
- Choose Calc > Calculator.
- In Store result in variable, enter Years.
- In Expression, enter ln(‘Years’).
- Click OK.
The logarithm of the variable is stored in the column of ‘ln(‘Years’)’.
Regression:
Software procedure:
Step by step procedure to obtain the regression equation using MINITAB software:
- Choose Stat > Regression > General Regression.
- Under Responses, enter the column of Yield.
- Under Model, enter the columns of ln(Years).
- Click OK.
Output using MINITAB software is given below:
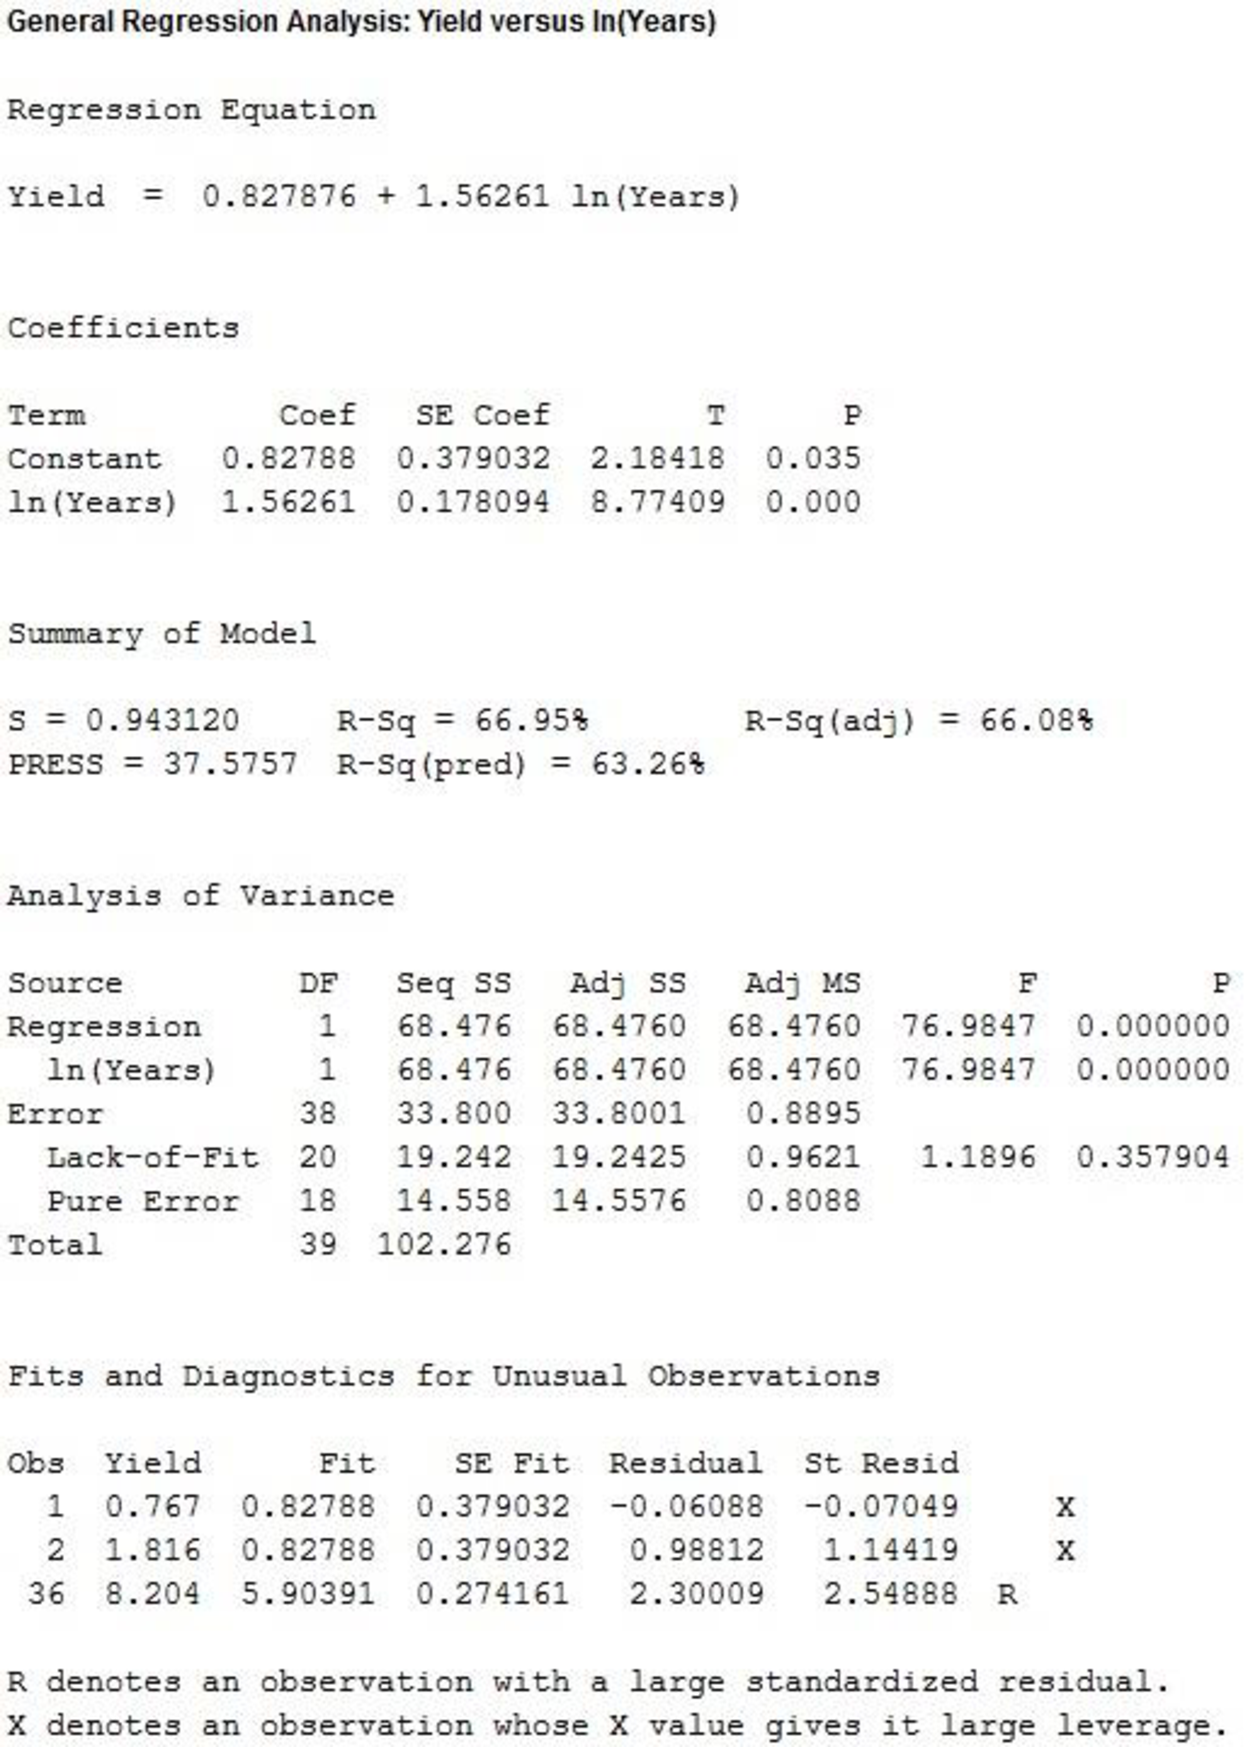
From the output, the estimated multiple regression equation using the natural logarithm of years as the independent variable is:
Adjusted-
The adjusted
The value of adjusted
The value of adjusted
Evidently, the current regression equation effectively explains more of the variation the response variable, than the second regression equation.
Thus, the estimated regression using the natural logarithm of x provides a better fit than the estimated regression developed in part b.
Want to see more full solutions like this?
Chapter 16 Solutions
Statistics for Business & Economics, Revised (with XLSTAT Education Edition Printed Access Card)


- Wing Foot is a shoe franchise commonly found in shopping centers across the United States. Wing Foot knows that its stores will not show a profit unless they gross over $940,000 per year. Let A be the event that a new Wing Foot store grosses over $940,000 its first year. Let B be the event that a store grosses over $940,000 its second year. Wing Foot has an administrative policy of closing a new store if it does not show a profit in either of the first two years. Assume that the accounting office at Wing Foot provided the following information: 58% of all Wing Foot stores show a profit the first year; 72% of all Wing Foot store show a profit the second year (this includes stores that did not show a profit the first year); however, 86% of Wing Foot stores that showed a profit the first year also showed a profit the second year. Compute P(B|Ac). Round your answer to the nearest hundredth.arrow_forwardYou draw two cards from a standard deck of 52 cards, but before you draw the second card, you put the first one back and reshuffle the deck. If you get a3on the first card, find the probability of drawing a 3 for the second card.arrow_forwardDo bonds reduce the overall risk of an investment portfolio? Let x be a random variable representing annual percent return for the Vanguard Total Stock Index (all Stocks). Let y be a random variable representing annual return for the Vanguard Balanced Index (60% stock and 40% bond). For the past several years, assume the following data. Compute the coefficient of variation for each fund. Round your answers to the nearest tenth. x: 14 0 37 21 35 23 24 -14 -14 -17 y: 8 -2 29 17 22 17 17 -2 -3 -8arrow_forward
- What percentage of the general U.S. population have bachelor's degrees? Suppose that the Statistical Abstract of the United States, 120th Edition, gives the following percentage of bachelor’s degrees by state. For convenience, the data are sorted in increasing order. 17 18 18 18 19 20 20 20 21 21 21 21 21 22 22 22 22 22 23 23 24 24 24 24 24 25 25 25 25 26 26 26 26 26 26 27 27 27 28 28 28 29 29 31 31 32 32 34 35 38 Illinois has a bachelor's degree percentage rate of about 18%. Into what quartile does this rate fall?arrow_forwardWhat percentage of the general U.S. population have bachelor's degrees? Suppose that the Statistical Abstract of the United States, 120th Edition, gives the following percentage of bachelor’s degrees by state. For convenience, the data are sorted in increasing order. 17 18 18 18 19 20 20 20 21 21 21 21 21 22 22 22 22 22 23 23 24 24 24 24 24 25 25 25 25 26 26 26 26 26 26 27 27 27 28 28 28 29 29 31 31 32 32 34 35 38 Illinois has a bachelor's degree percentage rate of about 18%. Into what quartile does this rate fall?arrow_forwardFind the range for the following sample data. x 23 17 11 30 27arrow_forward
- Do bonds reduce the overall risk of an investment portfolio? Let x be a random variable representing annual percent return for the Vanguard Total Stock Index (all Stocks). Let y be a random variable representing annual return for the Vanguard Balanced Index (60% stock and 40% bond). For the past several years, assume the following data. Compute the sample mean for x and for y. Round your answer to the nearest tenth. x: 11 0 36 22 34 24 25 -11 -11 -22 y: 9 -3 28 14 23 16 14 -3 -4 -9arrow_forwardDo bonds reduce the overall risk of an investment portfolio? Let x be a random variable representing annual percent return for the Vanguard Total Stock Index (all Stocks). Let y be a random variable representing annual return for the Vanguard Balanced Index (60% stock and 40% bond). For the past several years, assume the following data. Compute the range for variable y. X 12 0 36 21 35 23 24 -12 -12 -21 Y 10 -2 26 15 22 18 15 -2 -3 -10arrow_forwardDo bonds reduce the overall risk of an investment portfolio? Let x be a random variable representing annual percent return for the Vanguard Total Stock Index (all Stocks). Let y be a random variable representing annual return for the Vanguard Balanced Index (60% stock and 40% bond). For the past several years, assume the following data. Compute the range for variable y. X 12 0 36 21 35 23 24 -12 -12 -21 Y 10 -2 26 15 22 18 15 -2 -3 -10arrow_forward
- Do bonds reduce the overall risk of an investment portfolio? Let x be a random variable representing annual percent return for the Vanguard Total Stock Index (all Stocks). Let y be a random variable representing annual return for the Vanguard Balanced Index (60% stock and 40% bond). For the past several years, assume the following data. Compute the range for variable x. X 15 0 37 23 33 25 26 -15 -15 -23 Y 6 -1 28 18 24 17 18 -1 -2 -6arrow_forward7.16. If the probability density of X is given by g kx³ for x>0 f(x) = (1+2x)6 0 10-01, elsewhere trolls inf ( 2X density of the random variable Y = where k is an appropriate constant, find the probability 1+2X distribution of Y, and thus determine the value of k. 7 Identify thearrow_forward7.1. If X has an exponential distribution with the parameter 0, use the distribution function technique to find the probability density of the random variable Y = ln X. bilaga in dwreatarrow_forward
 Functions and Change: A Modeling Approach to Coll...AlgebraISBN:9781337111348Author:Bruce Crauder, Benny Evans, Alan NoellPublisher:Cengage Learning
 Glencoe Algebra 1, Student Edition, 9780079039897...AlgebraISBN:9780079039897Author:CarterPublisher:McGraw Hill
 Big Ideas Math A Bridge To Success Algebra 1: Stu...AlgebraISBN:9781680331141Author:HOUGHTON MIFFLIN HARCOURTPublisher:Houghton Mifflin Harcourt
 College AlgebraAlgebraISBN:9781305115545Author:James Stewart, Lothar Redlin, Saleem WatsonPublisher:Cengage Learning
 Algebra and Trigonometry (MindTap Course List)AlgebraISBN:9781305071742Author:James Stewart, Lothar Redlin, Saleem WatsonPublisher:Cengage Learning