
Applied Statistics in Business and Economics
5th Edition
ISBN: 9780077837303
Author: David Doane, Lori Seward Senior Instructor of Operations Management
Publisher: McGraw-Hill Education
expand_more
expand_more
format_list_bulleted
Videos
Textbook Question
Chapter 16, Problem 26CE
Instructions: In all exercises, you may use a computer package (e.g., MegaStat, Minitab) or show Excel calculations in a worksheet, depending on your instructor’s wishes. Include relevant output or screen shots to support your answers. If you do the calculations yourself, show your work. State the hypotheses and give the test statistic and its two-tailed p-value. Make the decision. If the decision is close, say so. Arc there issues of
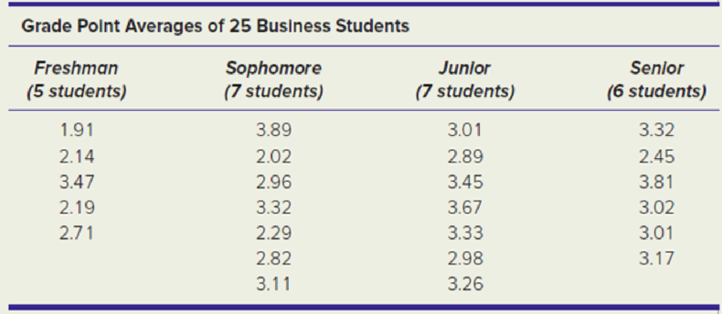
Below are grade point averages for 25 randomly chosen university business students during a recent semester. Research question: At α = .01, are the
Expert Solution & Answer
Want to see the full answer?
Check out a sample textbook solution
Students have asked these similar questions
Reconsider the patient satisfaction data in Table 1. Fit a multiple regression model using both patient age and
severity as the regressors.
(a) Test for significance of regression.
(b) Test for the individual contribution of the two regressors. Are both regressor variables needed in the model?
(c) Has adding severity to the model improved the quality of the model fit? Explain your answer.
The output voltage of a power supply is assumed to be normally distributed. Sixteen observations taken at
random on voltage are as follows: 10.35, 9.30, 10.00, 9.96, 11.65, 12.00, 11.25, 9.58, 11.54, 9.95, 10.28, 8.37,
10.44, 9.25, 9.38, and 10.85.
(a) Test the hypothesis that the mean voltage equals 12 V against a two-sided alternative using a = 0.05.
(b) Construct a 95% two-sided confidence interval on μ.
(c) Test the hypothesis that σ² = 11 using α = 0.05.
(d) Construct a 95% two-sided confidence interval on σ.
(e) Construct a 95% upper confidence interval on σ.
(f) Does the assumption of normality seem reasonable for the output voltage?
Analyze the residuals from the regression model on the patient satisfaction data from Exercise 3. Comment on
the adequacy of the regression model.
Chapter 16 Solutions
Applied Statistics in Business and Economics
Ch. 16.2 - Prob. 1SECh. 16.2 - Prob. 2SECh. 16.2 - Prob. 3SECh. 16.2 - Prob. 4SECh. 16.3 - A sample of 28 student scores on the chemistry...Ch. 16.3 - Prob. 6SECh. 16.4 - Prob. 7SECh. 16.4 - Prob. 8SECh. 16.5 - Prob. 9SECh. 16.5 - The results shown below are mean productivity...
Ch. 16.6 - Consumers are asked to rate the attractiveness of...Ch. 16.6 - Prob. 12SECh. 16.7 - Prob. 13SECh. 16.7 - Prob. 14SECh. 16 - Prob. 1CRCh. 16 - Prob. 2CRCh. 16 - Prob. 3CRCh. 16 - Prob. 4CRCh. 16 - Prob. 5CRCh. 16 - Prob. 6CRCh. 16 - Prob. 7CRCh. 16 - Prob. 8CRCh. 16 - Prob. 9CRCh. 16 - Prob. 10CRCh. 16 - (a) Why is a significant correlation not proof of...Ch. 16 - Prob. 15CECh. 16 - Prob. 16CECh. 16 - Prob. 17CECh. 16 - Prob. 18CECh. 16 - Prob. 19CECh. 16 - Instructions: In all exercises, you may use a...Ch. 16 - Prob. 21CECh. 16 - Prob. 22CECh. 16 - Prob. 23CECh. 16 - Prob. 24CECh. 16 - Prob. 25CECh. 16 - Instructions: In all exercises, you may use a...Ch. 16 - Prob. 27CECh. 16 - Instructions: In all exercises, you may use a...Ch. 16 - Prob. 29CECh. 16 - Prob. 30CECh. 16 - Prob. 31CECh. 16 - Prob. 32CECh. 16 - Prob. 33CECh. 16 - Prob. 34CECh. 16 - Instructions: In all exercises, you may use a...Ch. 16 - Prob. 36CECh. 16 - Prob. 37CE
Knowledge Booster


Learn more about
Need a deep-dive on the concept behind this application? Look no further. Learn more about this topic, statistics and related others by exploring similar questions and additional content below.Similar questions
- Consider the hypotheses: Hop=po H₁ppo where 2 is known. Derive a general expression for determining the sample size for detecting a true mean of 1μo with probability 1-ẞ if the type I error is a.arrow_forwardSuppose we wish to test the hypotheses: Họ : | = 15 H₁: 15 where we know that o² = 9.0. If the true mean is really 20, what sample size must be used to ensure that the probability of type II error is no greater than 0.10? Assume that a = 0.05.arrow_forwardTable 1 contains the data from a patient satisfaction survey for a group of 25 randomly selected patients at a hospital. In addition to satisfaction, data were collected on patient age and an index that measured the severity of illness. (a) Fit a linear regression model relating satisfaction to patient age. (b) Test for significance of regression. (c) What portion of the total variability is accounted for by the regressor variable age? Table 1: Patient Satisfaction Data Severity Observation Age (21) (x2) Satisfaction (y) 1 55 50 2 46 24 3 30 46 4 35 48 5 59 58 6 61 60 7 74 65 8 38 42 9 27 42 10 51 50 11 53 38 12 41 30 13 37 31 88 14 24 34 15 42 30 16 50 48 17 58 61 18 60 71 19 62 62 20 68 38 21 70 41 22 79 66 23 63 31 24 39 42 25 49 40 BE225222222222222222 68 77 96 80 43 44 26 88 75 57 56 88 102 88 70 43 46 56 59 26 83 75arrow_forward
- 14 A survey is conducted to determine whether would prefer to work at home, if given the 20 office employees of a certain company chance. The overall results are shown in the first bar graph, and the results broken down by gender are presented in the second. a. Interpret the results of each graph. b. Discuss the added value in including gen- der in the second bar graph. (The second bar graph in this problem is called a side by side bar graph and is often used to show results broken down by two or more variables.) c. Compare the side by side bar graph with the two pie charts that you made for Question 6. Which of the two methods is best for comparing two groups, in your opinion? A Would you prefer to work at home? (n=20) 60 50 40 Percent 20 30 20 30 10 0 No Yes Prefer to work at home? (10 males, 10 females) 80 Percent 60 00 40 40 20- No Yes No Yes Female Malearrow_forwardFrequency 12 Suppose that a random sample of 270 gradu- ating seniors are asked what their immediate priorities are, including whether buying a house is a priority. The results are shown in the following bar graph. a. The bar graph is misleading; explain why. b. Make a new bar graph that more fairly presents the results. Is Buying a House a Priority? 300 250 200 150 100 50 0 Yes No Undecidedarrow_forwardFrequency 11 A polling organization wants to find out what voters think of Issue X. It chooses a random sample of voters and asks them for their opinions of Issue X: yes, no, or no opinion. I organize the results in the following bar graph. a. Make a frequency table of these results (including the total number). brocb. Evaluate the bar graph as to whether it biz s b fairly represents the results. of beau no STORE TO OW! vd wob spind 550 540 500 vd 480 420 360 300 250 240 Yes No Undecided Opinion on Issue Xarrow_forward
- Percent 13 A car dealer specializing in minivan sales saibe conducts a survey to find out more about who its customers are. One of the variables at the company measures is gender; the results of this part of the survey are shown in the following bar graph. pow a. Interpret these results. b. Explain whether you think the bar graph is a fair and accurate representation of this data. 70 Gender of Customers 60 50 40 30 20 10 0 Males Femalesarrow_forwardThree cat- ency bar 10 Suppose that a health club asks 30 customers ad to rate the services as very good (1), good (2), fair (3), or poor (4). You can see the results in the following bar graph. What percentage of the customers rated the services as good? n; 2: pinion). of this to make a eople in ng ban?) Health Club Customer Ratings (1-very good,..., 4-poor) Frequency 10 8 00 6 11 A polling orga what voters t random samp for their opin no opinion. following ba a. Make a (includ bob. Evalua fairly tral 2 0 1 -2 3 4 540 480 420 360 300 240 Frequencyarrow_forward1 - Multiple Regression Equations and Predictions with XLMiner Analysis ToolPak (Structured) Video The owner of Showtime Movie Theaters, Inc., would like to predict weekly gross revenue as a function of advertising expenditures. Historical data for a sample of eight weeks are entered into the Microsoft Excel Online file below. Use the XLMiner Analysis ToolPak to perform your regression analysis in the designated areas of the spreadsheet. Due to a recent change by Microsoft you will need to open the XLMiner Analysis ToolPak add-in manually from the home ribbon. Screenshot of ToolPak X Open spreadsheet a. Develop an estimated regression equation with the amount of television advertising as the independent variable (to 2 decimals). JAN 27 Revenue = × TVAdv + b. Develop an estimated regression equation with both television advertising and newspaper advertising as the independent variables (to 2 decimals). Revenue = + TVAdy + NewsAdv c. Is the estimated regression equation coefficient for…arrow_forward
- Question 2: When John started his first job, his first end-of-year salary was $82,500. In the following years, he received salary raises as shown in the following table. Fill the Table: Fill the following table showing his end-of-year salary for each year. I have already provided the end-of-year salaries for the first three years. Calculate the end-of-year salaries for the remaining years using Excel. (If you Excel answer for the top 3 cells is not the same as the one in the following table, your formula / approach is incorrect) (2 points) Geometric Mean of Salary Raises: Calculate the geometric mean of the salary raises using the percentage figures provided in the second column named “% Raise”. (The geometric mean for this calculation should be nearly identical to the arithmetic mean. If your answer deviates significantly from the mean, it's likely incorrect. 2 points) Hint for the first part of question 2: To assist you with filling out the table in the first part of the question,…arrow_forwardConsider a sample with data values of 27, 25, 20, 15, 30, 34, 28, and 25. Compute the range, interquartile range, variance, and standard deviation (to a maximum of 2 decimals, if decimals are necessary). Range Interquartile range Variance Standard deviationarrow_forwardPerform a Step by step following tests in Microsoft Excel. Each of the following is 0.5 points, with a total of 6 points. Provide your answers in the following table. Median Standard Deviation Minimum Maximum Range 1st Quartile 2nd Quartile 3rd Quartile Skewness; provide a one sentence explanation of what does the skewness value indicates Kurtosis; provide a one sentence explanation of what does the kurtosis value indicates Make a labelled histogram; no point awarded if it is not labelled Make a labelled boxplot; no point awarded if it is not labelled Data 27 30 22 25 24 22 20 28 20 26 21 23 24 20 28 30 20 28 29 30 21 26 29 25 26 25 20 30 26 28 25 21 22 27 27 24 26 22 29 28 30 22 22 22 30 21 21 30 26 20arrow_forward
arrow_back_ios
SEE MORE QUESTIONS
arrow_forward_ios
Recommended textbooks for you
 Glencoe Algebra 1, Student Edition, 9780079039897...AlgebraISBN:9780079039897Author:CarterPublisher:McGraw Hill
 Holt Mcdougal Larson Pre-algebra: Student Edition...AlgebraISBN:9780547587776Author:HOLT MCDOUGALPublisher:HOLT MCDOUGAL
 Big Ideas Math A Bridge To Success Algebra 1: Stu...AlgebraISBN:9781680331141Author:HOUGHTON MIFFLIN HARCOURTPublisher:Houghton Mifflin Harcourt
 Algebra: Structure And Method, Book 1AlgebraISBN:9780395977224Author:Richard G. Brown, Mary P. Dolciani, Robert H. Sorgenfrey, William L. ColePublisher:McDougal Littell
Glencoe Algebra 1, Student Edition, 9780079039897...
Algebra
ISBN:9780079039897
Author:Carter
Publisher:McGraw Hill
Holt Mcdougal Larson Pre-algebra: Student Edition...
Algebra
ISBN:9780547587776
Author:HOLT MCDOUGAL
Publisher:HOLT MCDOUGAL
Big Ideas Math A Bridge To Success Algebra 1: Stu...
Algebra
ISBN:9781680331141
Author:HOUGHTON MIFFLIN HARCOURT
Publisher:Houghton Mifflin Harcourt
Algebra: Structure And Method, Book 1
Algebra
ISBN:9780395977224
Author:Richard G. Brown, Mary P. Dolciani, Robert H. Sorgenfrey, William L. Cole
Publisher:McDougal Littell
Hypothesis Testing using Confidence Interval Approach; Author: BUM2413 Applied Statistics UMP;https://www.youtube.com/watch?v=Hq1l3e9pLyY;License: Standard YouTube License, CC-BY
Hypothesis Testing - Difference of Two Means - Student's -Distribution & Normal Distribution; Author: The Organic Chemistry Tutor;https://www.youtube.com/watch?v=UcZwyzwWU7o;License: Standard Youtube License