
Find the reaction and plot the shear and bending moment diagram.
Explanation of Solution
Fixed end moment:
Formula to calculate the relative stiffness for fixed support
Formula to calculate the fixed moment for point load with equal length are
Formula to calculate the fixed moment for point load with equal length are
Formula to calculate the fixed moment for point load with unequal length are
Formula to calculate the fixed moment for UDL is
Calculation:
Consider the flexural rigidity EI of the beam is constant.
Show the free body diagram of the entire beam as in Figure 1.
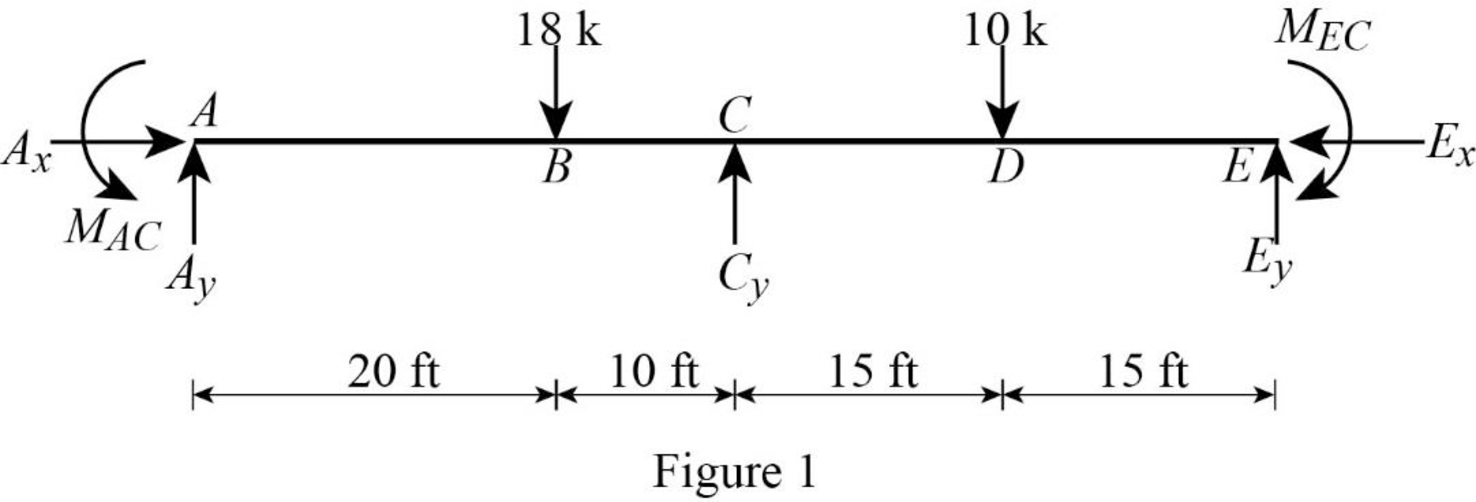
Refer Figure 1,
Calculate the relative stiffness
Calculate the relative stiffness
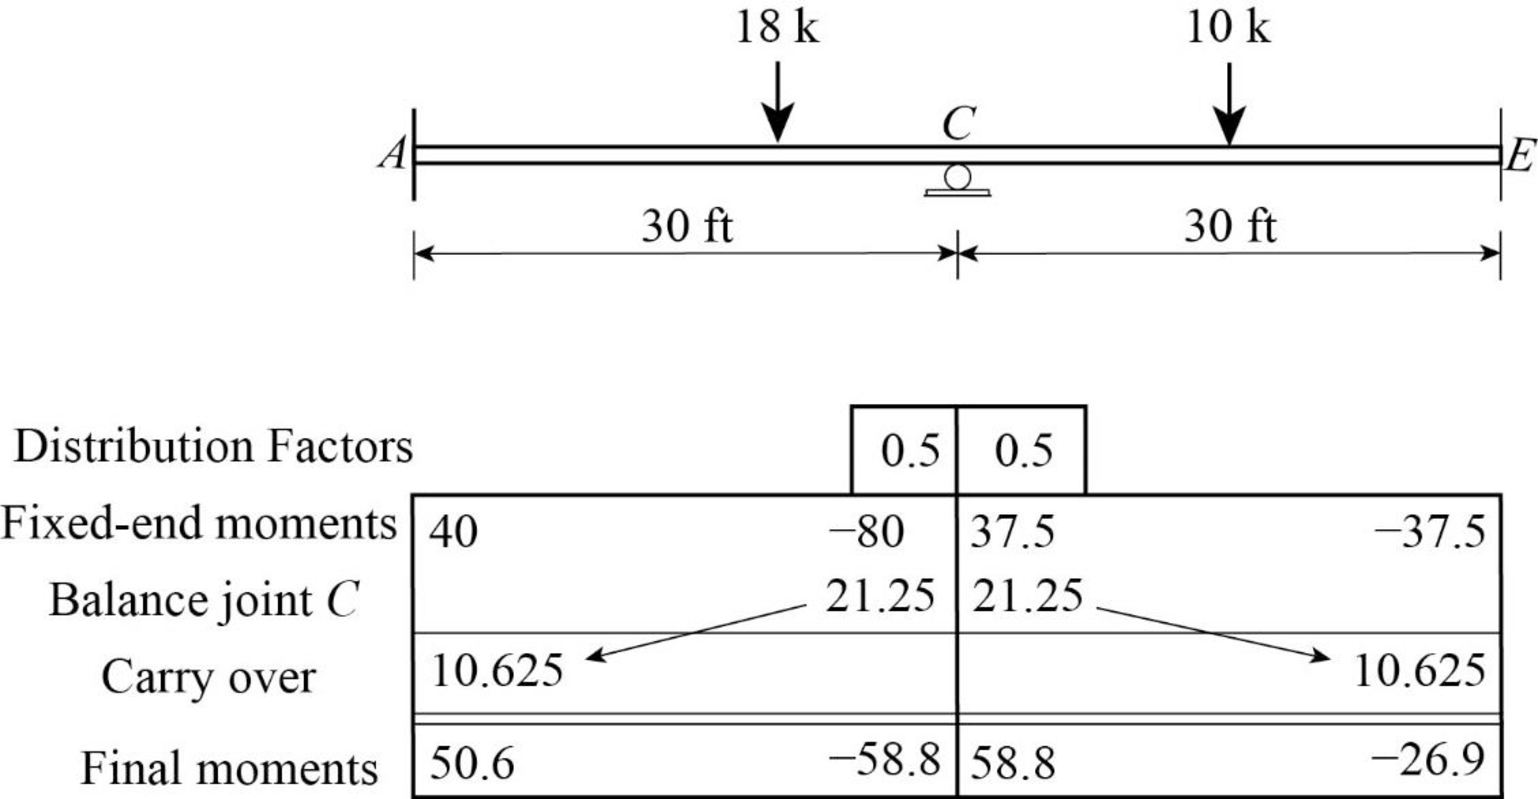
In the above beam, only joint C is free to rotate. Hence, calculate the distribution factor at joint C.
Calculate the distribution factor
Substitute
Calculate the distribution factor
Substitute
Check for sum of distribution factor:
Substitute 0.5 for
Hence, OK.
Calculate the fixed end moment for AC.
Calculate the fixed end moment for CA.
Calculate the fixed end moment for CE.
Calculate the fixed end moment for EC.
Show the calculation of final moments using moment distribution method as in Table 1.
Consider the member AC of the beam:
Show the free body diagram of the member AC as in Figure 2.
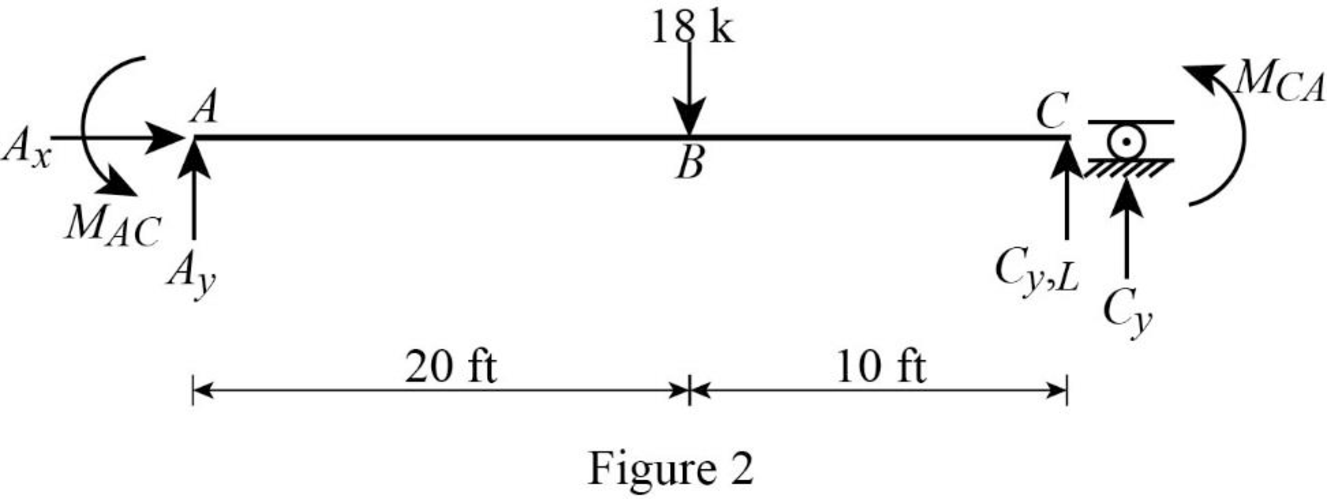
Calculate the vertical reaction at the left end of the joint C by taking moment about point A.
Calculate the horizontal reaction at point A by resolving the horizontal equilibrium.
Calculate the vertical reaction at point A by resolving the vertical equilibrium.
Consider the member CE of the beam:
Show the free body diagram of the member CE as in Figure 3.
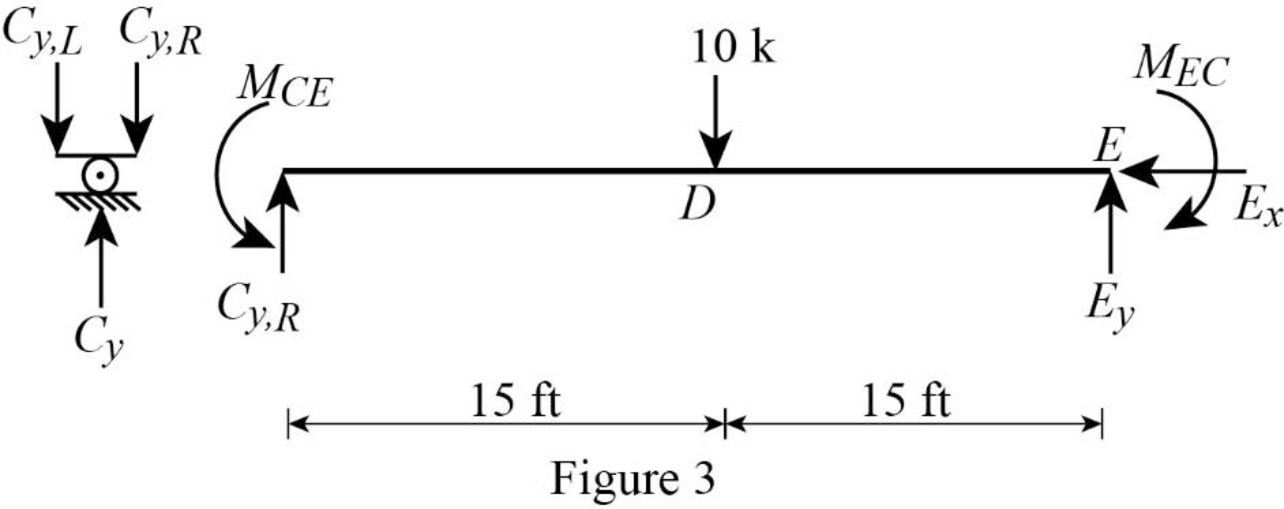
Calculate the vertical reaction at the right end of the joint C by taking moment about point E.
Calculate the horizontal reaction at point E by resolving the horizontal equilibrium.
Calculate the vertical reaction at point E by resolving the vertical equilibrium.
Calculate the total reaction at point C.
Substitute
Show the reaction of the beam in Figure 4.
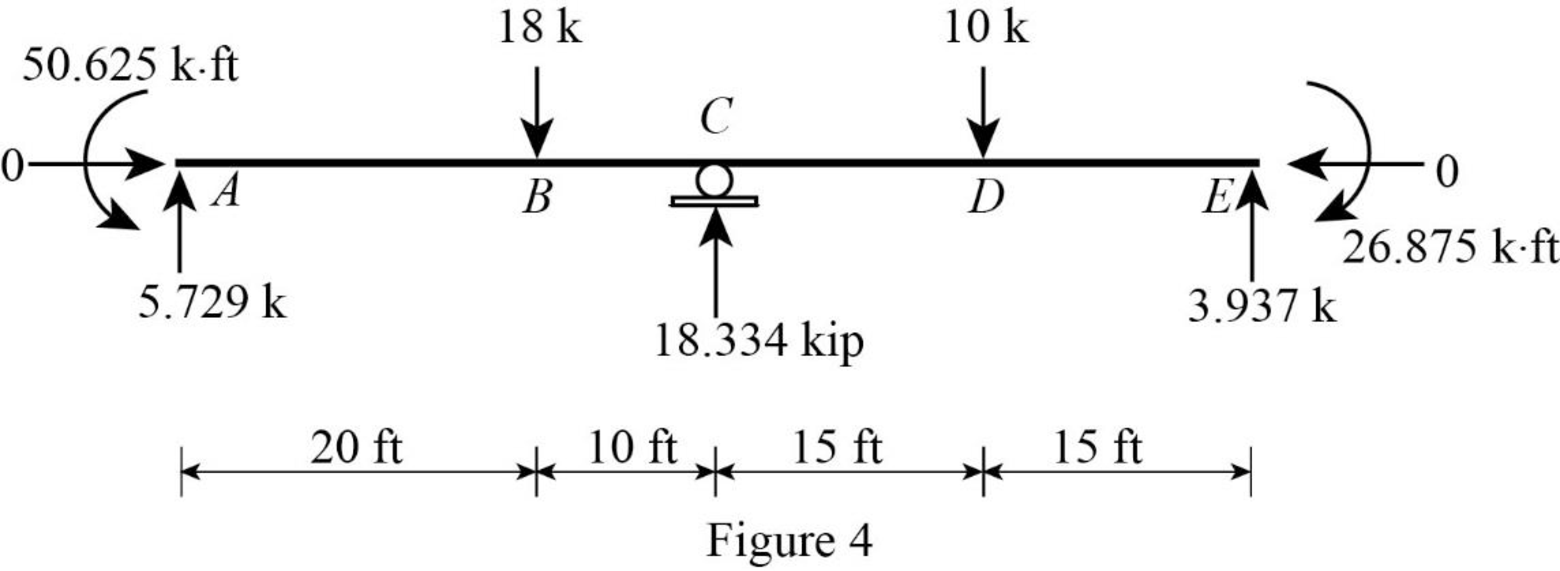
Refer Figure 4,
Shear diagram:
Point A:
Point B:
Point C:
Point D:
Point E:
Plot the shear force diagram of the beam as in Figure 5.
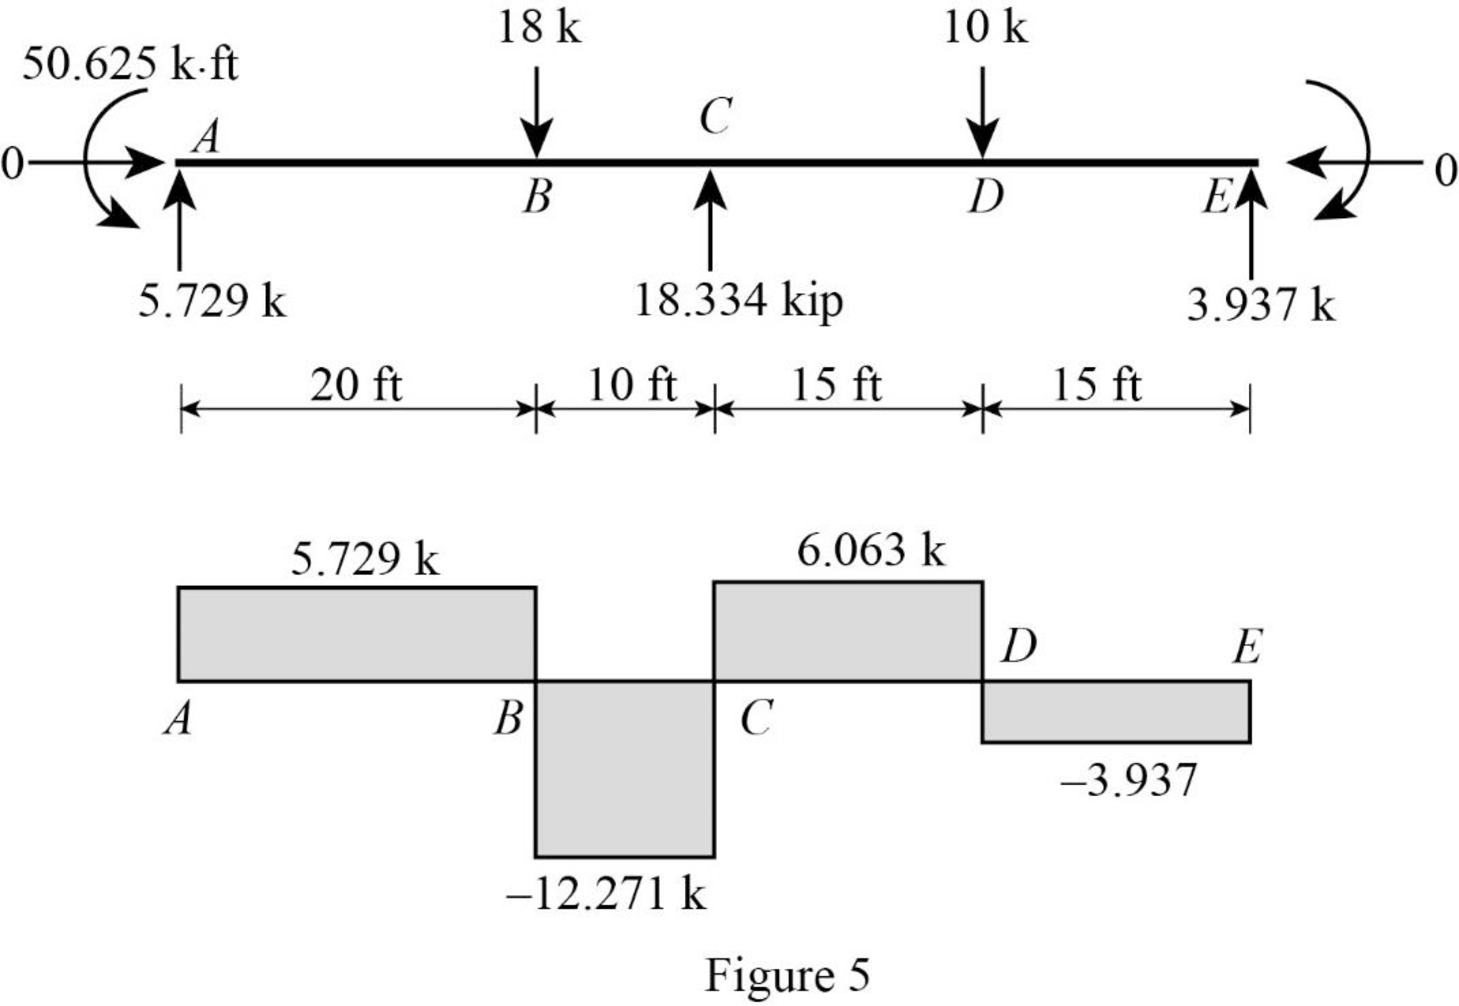
Refer Figure 4,
Bending moment diagram:
Point A:
Point B:
Point C:
Point D:
Point E:
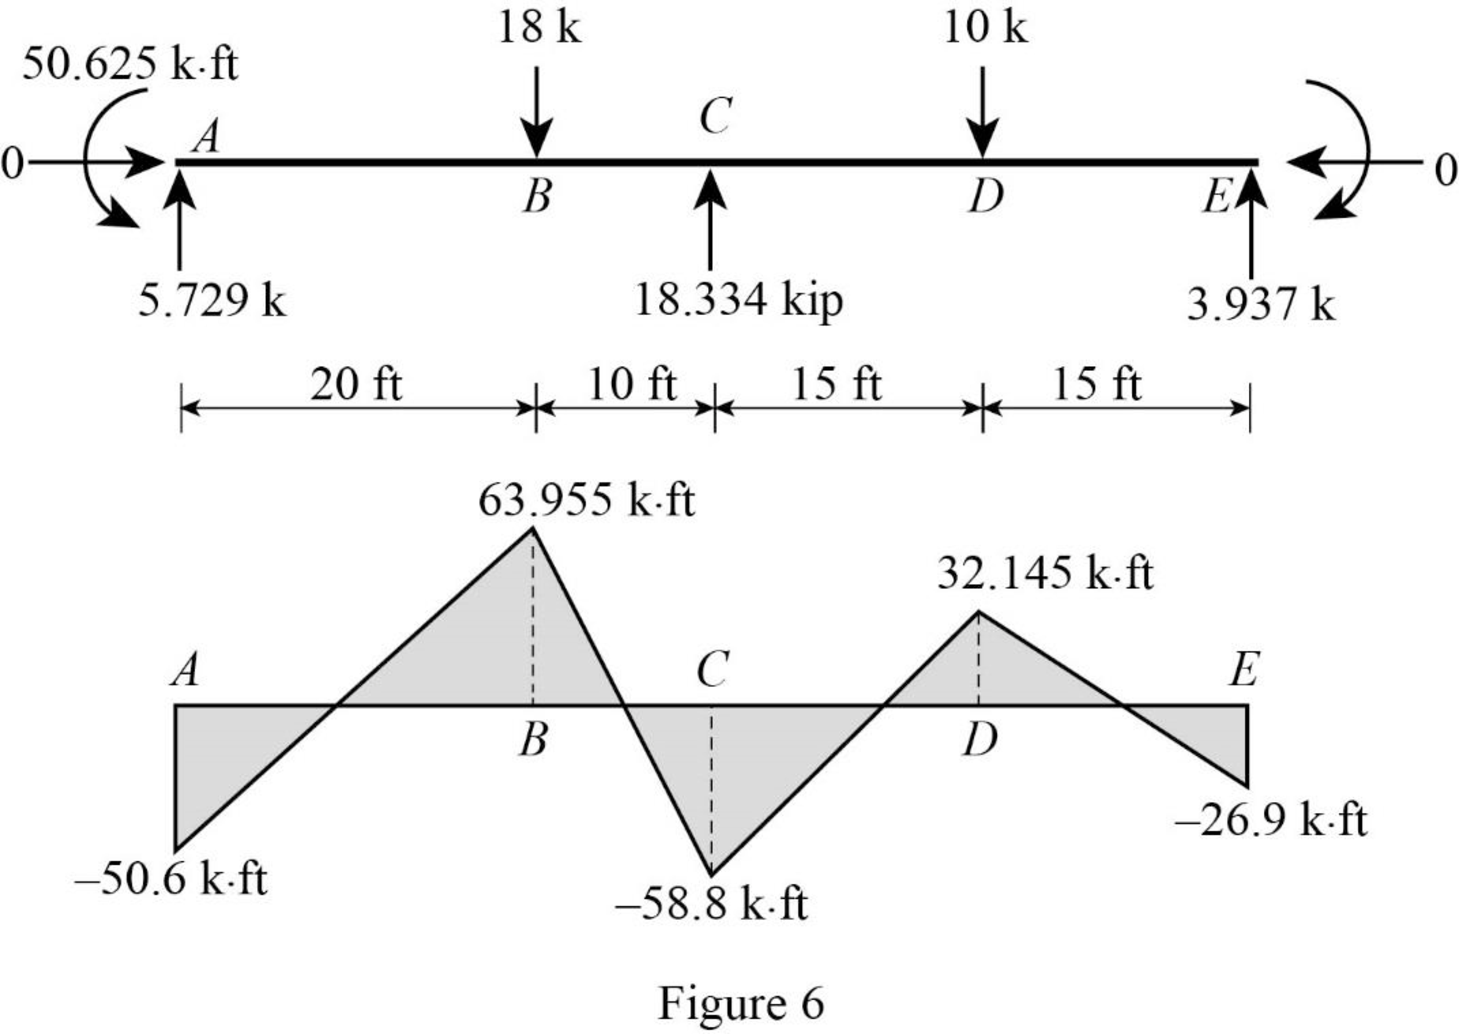
Plot the bending moment diagram of the beam as in Figure 6.
Want to see more full solutions like this?
Chapter 16 Solutions
Structural Analysis, SI Edition

- 1. Calculate the ultimate load carrying capacity of the pile tip driven into the soil profile shown below: G.W.T. 45' Qapp Soft Clay: Ysat 100 pcf Cu 500 psf, ou = 0° 平 12' Soil Plug Driven Steel Pipe Pile: Outside Diameter = 2' Inside Diameter = 1'11" Hollow (soil plugged) Note: Pile & soil profile are not drawn to scale Qp = ? Please perform the tip capacity calculation two ways: For the first approach, assume that the total vertical stress at the pile tip is balanced by the weight of the pile. For the second approach, assume that the total vertical stress at the pile tip is not balanced by the weight of the pile (which means you need to include the vertical total stress term). Please compare your answers from these two analyses, examine some of your intermediate-stage calculation results such as the total overburden stress at the pile tip relative to the weight of the pile, and discuss whether or not the commonly used assumption about the total vertical stress at the pile tip is a…arrow_forwardA6.2- Given a simply supported beam with the typical cross-section as shown in the figure below. Assume interior exposure for this beam. The beam properties are summarized below. a) Check if the beam section satisfies the CSA A23.3 cracking control requirements. In your calculations, find f, accurately based on the loading, and compare the results with f = 0.6 fy. b) Find the deflection due to DL+LL at mid-span after 6 years. Given: Concrete: Normal density with f'c = 25 MPa Reinforcement: Uncoated rebars with fy = 400 MPa Shear reinforcement: 10M Maximum aggregate size: 20 mm Clear cover to the stirrup: 30 mm Clear spacing between the bars = 35 mm 35 mm 30 mm m WDL= 20 kN/m WLL= 15 kN/m 抖抖 b=400 mm As = 8-25M Cross-section h=500 mmarrow_forwardA5.1- An unbraced column shown in Figure 1, column A-B with square cross-section is given. The column is subjected to Dead load (unfactored): PDL = 3000 kN, MDL-top = 85 kN.m, MDL-bo = -DL-bottom = 100 kN.m. = Assume the cross-section of column is constant from top to bottom, and all the beams have width = 300 mm and height 350 mm. Using f'c = 25 MPa, fy = 400 MPa, design the column and determine the ties spacing and arrangement. Use 25M or 30M bars for longitudinal reinforcement, and 10M bars for ties. Assume clear cover to be 40mm. The design p has to be between 0.01 and 0.02. Column maximum dimension can be 500mm. т 4.0m 7.0m 5.5m + 6.5m Figure 1 Barrow_forward
- 7.43 Neglecting head losses, determine what horsepower the pump must deliver to produce the flow as shown. Here, the elevations at points A, B, C, and D are 124 ft, 161 ft, 110 ft, and 90 ft, respectively. The nozzle area is 0.10 ft². B Nozzle Water C D Problem 7.43arrow_forwardNOTE: Use areal methods only for V,M,N diagrams(Do NOT use the equations) (also draw the N diagram(s) for the entire structure)arrow_forwardNOTE: Use areal methods only for V,M,N diagrams(Do NOT use the equations) (also draw the N diagram(s) for the entire structure)arrow_forward
- NOTE: Use areal methods only for V,M,N diagrams(Do NOT use the equations) (also draw the N diagram(s) for the entire structure)arrow_forwardNOTE: Use areal methods only for V,M,N diagrams(Do NOT use the equations) (also draw the N diagram(s) for the entire structure)arrow_forwardNOTE: Use areal methods only for V,M,N diagrams(Do NOT use the equations) (also draw the N diagram(s) for the entire structure)arrow_forward
- NOTE: Use areal methods only for V,M,N diagrams(Do NOT use the equations) (also draw the N diagram(s) for the entire structure)arrow_forwardProblem 2: Use the table below to compute the coordinates of the centroid of area shown below. y – 3 in.—|— 4 in. - -3 3 in. 3 in. x Area X X * Area y Y * Area Component (in²) (in) (in³) (in) (in³) Square 1 Rectangle 2 Triangle 3 Rectangle 4 Σarrow_forwardA shallow foundation measuring 1 m × 2 m in plan is to be constructed over a normally consolidated sand layer. Given: D₁ = 1 m, №60 increases with depth, N 60 (in the depth of stress influence) = 11, Estimate the elastic settlement using Burland and Burbidge's method. (Enter your answer to three significant figures.) Se mm and Inet = 138 kN/m².arrow_forward
