Concept explainers
To fill:
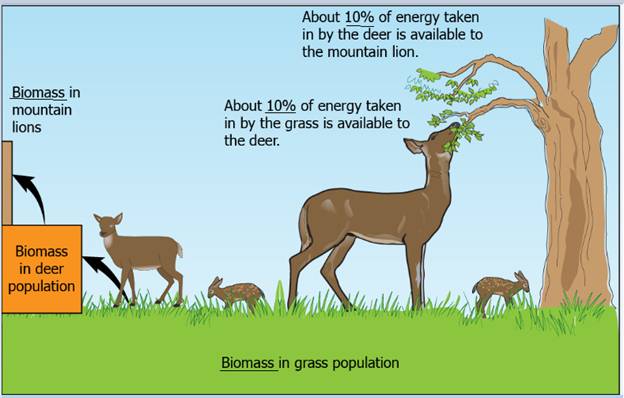
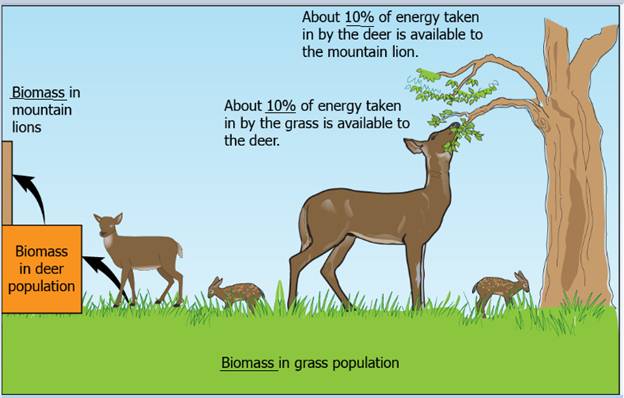
The blanks in the given figure.
Introduction:
Extinction vortex is a model that helps the ecologists, biologists, and geneticists to determine the reason for the extinction of the species. This model reveals the causes that lead to the vulnerability of the small populations, as they spiral toward the extinction. This model was developed by M. E. Gilpin and M. E Soule in 1986.
Answer to Problem 1LTB
The figure below is labeled as:

Explanation of Solution
The given figures are the depiction of a graph which determines the amount of biomass of grass population transferred to mountain lions. The grass is an autotroph and makes its own food by the help of photosynthesis. When deer eat this grass, then only 10% of the energy in the grass is transferred to the deer. Further, when the lion eats the deer, then again, only 10% of the energy taken by the deer is transferred to the mountain lion.
The figure below is labeled as:

Want to see more full solutions like this?
Chapter 16 Solutions
BELK SCIENCE F/LIFE-MASTRG. BIOL.AC+EBK
- In a natural population of outbreeding plants, the variance of the total number of seeds per plant is 16. From the natural population, 20 plants are taken into the laboratory and developed into separate true-breeding lines by self- fertilization-with selection for high, low, or medium number of seeds-for 10 generations. The average variance in the tenth generation in each of the 20 sets is about equal and averages 5.8 across all the sets. Estimate the broad-sense heritability for seed number in this population. (4 pts) 12pt v Paragraph BI DI T² v ✓ B°arrow_forwardQuestion 1 In a population of Jackalopes (pictured below), horn length will vary between 0.5 and 2 feet, with the mean length somewhere around 1.05 feet. You pick Jackalopes that have horn lengths around 1.75 feet to breed as this appears to be the optimal length for battling other Jackalopes for food. After a round of breeding, you measure the offsprings' mean horn length is 1.67. What is the heritability of horns length (h2)? Is Jackalope horn length a heritable trait? (4 pts)? 12pt v Paragraph BIU A ✓arrow_forwardFrequency of allele A1 Question 2 The graph below shows results of two simulations, both depicting the rise in frequency of beneficial allele in a population of infinite size. The selection coefficient and the starting frequency are the same, but in one simulation the beneficial allele is dominant and in the other it is recessive. Neither allele is fixed by 500 generations. 1.0 1 0.8 0.6 0.4 2 0.2 0 0 100 200 300 400 500 Generation (a) Which simulation shows results for a dominant and which shows results for a recessive allele? How can you tell? (4 pts) (b) Neither of the alleles reaches fixation by 500 generations. If given enough time, will both of these alleles reach fixation in the population? Why or why not? (3 pts) 12pt Paragraph BIU AT2v Varrow_forward
- Question 14 The relative fitnesses of three genotypes are WA/A= 1.0, WA/a = 0.7, and Wa/a = 0.3. If the population starts at the allele frequency p = 0.5, what is the value of p in the next generation? (3 pts) 12pt v V Paragraph B I U D V T² v V V p O words <arrow_forwardAccording to a recent study, 1 out of 50,000 people will be diagnosed with cystic fibrosis. Cystic fibrosis can be caused by a mutant form of the CFTR gene (dominant gene symbol is F and mutant is f). A. Using the rate of incidence above, what is the frequency of carriers of the cystic fibrosis allele for CFTR in the US? (3 pts) B. In a clinical study, 400 people from the population mentioned in (A.) were genotyped for BRCA1 Listed below are the results. Are these results in Hardy- Weinberg equilibrium? Use Chi Square to show whether or not they are. (3 pts) BRCA1 genotype # of women 390 BB Bb bb 10 0 12pt Paragraph L BIUAV V T² v Varrow_forwardOutline a method for using apomixis to maintain feminized CannabisAssume apomixis is controlled by a single dominant gene. You can choose the type of apomixis: obligate or facultative, gametophytic or sporophytic. Discuss advantages and disadvantages of your proposed method.arrow_forward
- Kinetics: One-Compartment First-Order Absorption 1. In vivo testing provides valuable insight into a drug’s kinetics. Assessing drug kinetics following multiple routes of administration provides greater insight than a single route of administration alone. The following data was collected in 250-g rats following bolus IV, oral (PO), and intraperitoneal (ip) administration. Using this data and set of graphs, determine:(calculate for each variable) (a) k, C0, V, and AUC* for the bolus iv data (b) k, ka, B1, and AUC* for the po data c) k, ka, B1, and AUC* for the ip data (d) relative bioavailability for po vs ip, Fpo/Fip (e)absolute ip bioavailability, Fip (f) absolute po bioavailability, Fpoarrow_forward3. A promising new drug is being evaluated in human trials. Based on preliminary human tests, this drug is most effective when plasma levels exceed 30 mg/L. Measurements from preliminary tests indicate the following human pharmacokinetic parameter values: t1/2,elim = 4.6hr, t1/2,abs = 0.34hr, VD = 0.29 L/kg, Foral = 72%. Based on these parameters, estimate the following if a 49 kg woman were to receive a 1000mg oral dose of this drug: (a) Estimate the plasma concentration of the drug at 1hr, 6 hr, and 20hr after taking the drug ( Concentration estimate) (b) Estimate the time for maximum plasma concentration (tmax). (c) Estimate the maximum plasma concentration (Cmax). (d) Estimate the time at which the plasma level first rises above 30 mg/L. (Note this is a trial and error problem where you must guess a time, plug it into the concentration equation, and determine if it is close to 30 mg/L. Hint: based on part (a) it should be apparent that the answer is less than 1hr.) (e)…arrow_forwardList substitutions in your diet you could make to improve it based on what you know now about a balanced diet. For instance, if you like to drink soda, you might substitute skim milk or water for some of the soft drinks you consumed. List the item you wish to replace with the new item and what you hope to accomplish with that substitution. Be sure to choose foods you know that you'd enjoy and you consider more "healthful." If you feel your diet is already balanced, describe how you accomplish your balanced intake and when you began eating this way.arrow_forward
- Which single food item contained you ate for the 3 days with the most sodium?arrow_forwardSelect a diet and choose one site that provides credible information. Explain why the source itself and/or the information on the site is credible. This should be a report. This site should be different from U.S News and World Report. For full credit, you must include the following information and elaborate in detail: The diet name The main components of the diet The credible website name and link What makes the credible website credible?arrow_forwardSelect a diet and give a summary of the main components. Do a web search of the diet and choose one link that provides misinformation. Explain why the site itself and/or the information on the site is not credible. This should be a report. This site should be different from U.S News and World Report. For full credit, you must include the following information and elaborate in detail: The diet name The main components of the diet The misinformation website and link What misinformation is being provided in the other website and how did you determine it was not credible?arrow_forward
 Concepts of BiologyBiologyISBN:9781938168116Author:Samantha Fowler, Rebecca Roush, James WisePublisher:OpenStax College
 Biology: The Dynamic Science (MindTap Course List)BiologyISBN:9781305389892Author:Peter J. Russell, Paul E. Hertz, Beverly McMillanPublisher:Cengage Learning
 Biology (MindTap Course List)BiologyISBN:9781337392938Author:Eldra Solomon, Charles Martin, Diana W. Martin, Linda R. BergPublisher:Cengage Learning
 Biology 2eBiologyISBN:9781947172517Author:Matthew Douglas, Jung Choi, Mary Ann ClarkPublisher:OpenStax


