Concept explainers
Discovery of Iridium in the K–Pg Boundary Layer In the late 1970s, geologist Walter Alvarez was investigating the composition of the K–Pg boundary layer in different parts of the world. He asked his father, Nobel Prize–winning physicist Luis Alvarez, to help him analyze the elemental composition of the layer. The Alvarezes and their colleagues tested the K-Pg boundary layer in Italy and Denmark, and discovered that it contains a much higher iridium content than the surrounding rode layers (FIGURE 16.17). Iridium belongs to a group of elements that are much more abundant in asteroids and other solar system materials than they are in Earth’s crust. The Alvarez group concluded that the K–Pg boundary layer must have originated with extraterrestrial material.
Sample Depth | Average Abundance of Iridium (ppb) |
+2.7m | <0.3 |
+1.2m | <0.3 |
+0.7m | 0.36 |
boundary layer | 41.6 |
–0.5 m | 0.25 |
–5.4 m | 0.30 |
FIGURE 16.17 Abundance of iridium in and near the K–Pg boundary layer.
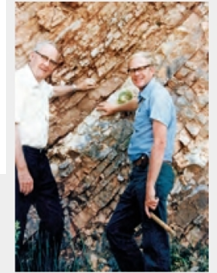
Iridium content of rock samples above, below, and at the K–Pg boundary layer in Stevns Klint, Denmark. Sample depths are given as meters above or below the layer. ppb, parts per billion. An average Earth rock contains 0.4 ppb iridium; the average meteorite, 550 ppb. The photo shows Luis and Walter Alverez next to the K–Pg boundary layer in Stevns Klint.
What was the iridium content of the K–Pg boundary layer?
To determine: The iridium content of the K–Pg boundary layer.
Introduction: The iridium is a chemical element that is abundantly found in the Cretaceous–Paleogene (K–Pg) boundary layer. The iridium level in an average rock is about 0.4 ppb, and in an average meteorite, it is about 550 ppb. This allows scientists to conclude whether the origin of the rocks is from the Earth or from any other sources.
Explanation of Solution
As given in the problem statement, Researcher W examined the composition of the K–Pg boundary layer in various parts of the world. He took help from his father to examine the composition of elements in the layer. Researcher L and his colleagues tested the K–Pg boundary layer in Country D and Country I. They discovered that the iridium content was found to be in large quantity than the surrounding rock layers. They also concluded that the boundary layer may have originated with the extraterrestrial material.
Refer to Fig. 16.17, “Abundance of iridium in and near the K-Pg boundary layer”, in the textbook. The given table shows the average abundance of iridium (ppb), and the sample depth (in meters) in Country D. The chemical element iridium was found in abundance on an average of about 41.6 ppb in the K–Pg boundary layer.
The iridium content was 41.6 ppb in the K–Pg boundary layer.
Want to see more full solutions like this?
Chapter 16 Solutions
Biology: The Unity and Diversity of Life (MindTap Course List)
Additional Science Textbook Solutions
Genetics: From Genes to Genomes
Biological Science (6th Edition)
Laboratory Manual For Human Anatomy & Physiology
Campbell Biology in Focus (2nd Edition)
Chemistry: Structure and Properties (2nd Edition)
- Discovery of Iridium in the KPg Boundary Layer In the late 1970s, geologist Walter Alvarez was investigating the composition of the KPg boundary layer in different parts of the world. He asked his father, Nobel Prizewinning physicist Luis Alvarez, to help him analyze the elemental composition of the layer. The Alvarezes and their colleagues tested the K-Pg boundary layer in Italy and Denmark, and discovered that it contains a much higher iridium content than the surrounding rode layers (FIGURE 16.17). Iridium belongs to a group of elements that are much more abundant in asteroids and other solar system materials than they are in Earths crust. The Alvarez group concluded that the KPg boundary layer must have originated with extraterrestrial material. Sample Depth Average Abundance of Iridium (ppb) +2.7m 0.3 +1.2m 0.3 +0.7m 0.36 boundary layer 41.6 0.5 m 0.25 5.4 m 0.30 FIGURE 16.17 Abundance of iridium in and near the KPg boundary layer. Iridium content of rock samples above, below, and at the KPg boundary layer in Stevns Klint, Denmark. Sample depths are given as meters above or below the layer. ppb, parts per billion. An average Earth rock contains 0.4 ppb iridium; the average meteorite, 550 ppb. The photo shows Luis and Walter Alverez next to the KPg boundary layer in Stevns Klint. How much higher was the iridium content of the boundary layer than the sample taken 0.7 meter above it?arrow_forwardDiscovery of Iridium in the K-Pg Boundary Sequence In the late 1970s, geologist Walter Alvarez was investigating the composition of the K-Pg boundary sequence in different parts of the world. He asked his father, Nobel Prize-winning physicist Luis Alvarez, to help him analyze the elemental composition of the layer. The Alvarezes and their colleagues tested the K-Pg boundary sequence in Italy and Denmark. They discovered that it contains a much higher iridium content than the surrounding rock layers. Some of their results are shown in FIGURE 16.18. Iridium belongs to a group of elements (Appendix I) that are much more abundant in asteroids and other solar system materials than they are in Earths crust. The Alvarez group concluded that the K-Pg boundary sequence must have originated with extraterrestrial material. They calculated that an asteroid 14 kilometers (8.7 miles) in diameter would contain enough iridium to account for the extra iridium in the K-Pg boundary sequence. FIGURE 18.16 Abundance of iridium in and near the K-Pg boundary sequence in Stevns Klint, Denmark. Many rock samples taken from above, below, and at the boundary were tested for iridium content. Depths are given as meters above or below the boundary. The iridium content of an average Earth rock is 0.4 parts per billion (ppd) of iridium. An average metecrite contains about 550 parts per billion of iridium. The photo shows Luis and Walter Alvarez with a section of the boundary sequence. l. What was the iridium content of the K-Pg boundary sequence?arrow_forwardMost people tend to think that if the sun ever stopped emittinglight, all animal life on Earth would soon end. Populations ofhydrothermal-vent animals might continue to exist for thousands ofyears, however. Explain.arrow_forward
- Researchers examining decomposition in a freshwater marsh estimated the tollowing decomposition rate constants: k 0.058-0.61 d1 for the soft tissues of fish and waterfowl; and k = 0.03-0.05 d for aquatic plants. Decomposition was measured under similar environmental conditions. %3D %3D (A) Based on the estimated rate constants, which type of material-animal (i.e. fish, waterfowl) or plant (i.e. aquatic plants)-decomposes faster? (B) What is a likely explanation for this pattern? E.g., how would C:N compare between the two materials? [2-3 sentences]arrow_forwardWhy ozone hole forms over Antarctica? How will enhanced ultraviolet Radiations affect us?arrow_forwardIn stratosphere, which elements acts as a catalyst in degradation of ozone and release of molecular oxygen?arrow_forward
- prus Cycle D O d-ons Help Last edit was 22 minutes ago Calibri BIUA o回0- E= == E 公 12 21 https://www.youtube.com/watch?v=Wzo UFSZLUA Watch the video and use ONLY the video to answer the following questions. 1. Is phosphorus found in the atmosphere?In the atmosphere phosphorus can mainly be found as very small dust particles. 2. Name 5 things that phosphorus does for our planet and for us: b. C.arrow_forwardDead organic matter commonly decomposes in a pattern that follows a negative exponential curve. Scientists wanted to compare the decomposition rates of leaves from cherry trees and maple trees. The scientists placed bags of leaves from each type of tree into a stream and retrieved the bags over time. The scientists repeated the experiment three times. The scientists calculated and graphed the mean amount of litter remaining of each leaf type at all time points. When plants decompose, the dead plant matter first leaches substances such as salts, sugars, and amino acids. After this leaching, one compound left behind is lignin. Lignin gives leaves their toughness and resists decomposition. Leaf mass remaining (grams) 1004 75+ 50- 25- O 25 50 75 Time (days) Maple Cherry 100 Select the statement the data support about the rate of leaf decomposition and the amount of lignin present in leaves. O Since the maple leaves decompose the slowest, they have a greater amount of lignin. O Since the…arrow_forwardon k. 7.2 Natural carbon recycling ADVANCED STANDARD Science understanding FOUNDATION bushfire (n) a forest fire that is out of contral Carbon is the basis of all life on Earth. There is a fixed amount of carbon on Earth and this carbon is continuously recycled and reuscu. It takes carbon about 100 million vears to complete one cycle through the lithosphere (rock, soil, land), bydrosphere (oceans, lakes, rivers), the atmosphere and the biosphere. controlled burn In) a supervised fire Carbon stores HINT The Earth's four major carbon stores (or sinks) are-the atmosphere, occans, terrestrial ecosystems (on land) and Earth's crust. 1 Gigatonne = 10 tonne = 10" kg Table 7.2.1 Earth's principal carbon stores in gigatonnes (Gt) Stores of carbon Gigatonnes (Gt) Gigatonnes (Gt) Stores of carbon marine sediments and 3000 sedimentary rocks 66000 000-100 000 000 coal deep oceans soils and organic matter 1600 40 000 surface oceans 1000 oil and gas 300 vegetation 540-610 the atmosphere 750 Plants…arrow_forward
- Changes in the Air To assess the impact of human activity on the carbon dioxide level in Earth's atmosphere, it helps to take a long view. One useful data set comes from deep core samples of Antarctic ice. The oldest ice core that has been fully analyzed dates back a bit more than 400,000 years. Air bubbles trapped in the ice provide information about the gas content in Earth's atmosphere at the time the ice formed. Combining ice core data with more recent direct measurements of atmospheric carbon dioxideas in FIGURE 46.20can help scientists put current changes in the atmospheric carbon dioxide into historical perspective. FIGURE 46.20 Changes in atmospheric carbon dioxide levels (in parts per million). Direct measurements began in 1980. Earlier data are based on ice cores. The industrial revolution occurred around 1800. What was the trend in carbon dioxide level in the 800 years prior to this event? What about in the 175 years after it?arrow_forwardChanges in the Air To assess the impact of human activity on the carbon dioxide level in Earth's atmosphere, it helps to take a long view. One useful data set comes from deep core samples of Antarctic ice. The oldest ice core that has been fully analyzed dates back a bit more than 400,000 years. Air bubbles trapped in the ice provide information about the gas content in Earth's atmosphere at the time the ice formed. Combining ice core data with more recent direct measurements of atmospheric carbon dioxideas in FIGURE 46.20can help scientists put current changes in the atmospheric carbon dioxide into historical perspective. FIGURE 46.20 Changes in atmospheric carbon dioxide levels (in parts per million). Direct measurements began in 1980. Earlier data are based on ice cores. 4. Was the rise in the carbon dioxide level between 1800 and 1975 larger or smaller than the rise between 1980 and 2013?arrow_forwardMercury Emissions by Continent By weight, coal does not contain much mercury, but we burn a lot of it. Several industries besides coal-fired power plants contribute substantially to atmospheric mercury pollution. FIGURE 2.13 shows mercury emissions by industry from different regions of the world in 2010. FIGURE 2.13 Global mercury emissions by sector, 2010. Which region emitted the most mercury from burning fossil fuels?arrow_forward
- Biology Today and Tomorrow without Physiology (Mi...BiologyISBN:9781305117396Author:Cecie Starr, Christine Evers, Lisa StarrPublisher:Cengage LearningBiology: The Unity and Diversity of Life (MindTap...BiologyISBN:9781337408332Author:Cecie Starr, Ralph Taggart, Christine Evers, Lisa StarrPublisher:Cengage LearningBiology: The Unity and Diversity of Life (MindTap...BiologyISBN:9781305073951Author:Cecie Starr, Ralph Taggart, Christine Evers, Lisa StarrPublisher:Cengage Learning