ORGANIC CHEMISTRY
9th Edition
ISBN: 9780134645704
Author: WADE AND SIMEK
Publisher: PEARSON
expand_more
expand_more
format_list_bulleted
Concept explainers
Videos
Textbook Question
Chapter 16, Problem 16.45SP
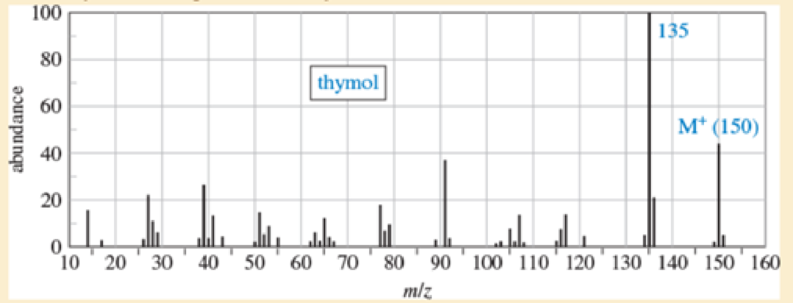
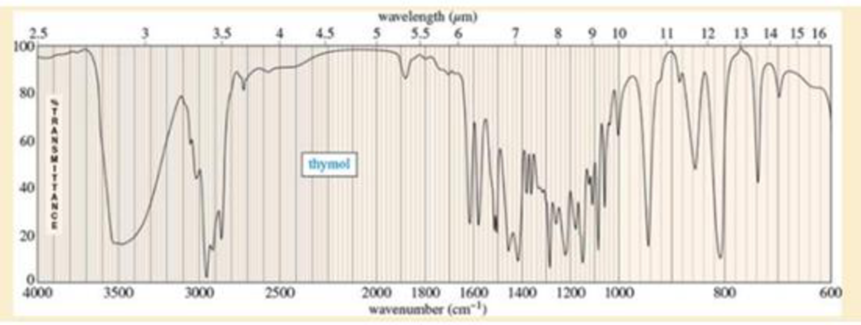
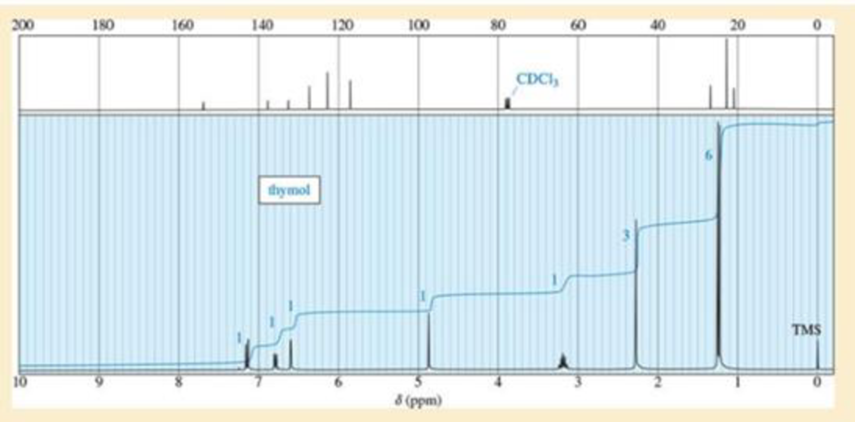
A student found an old bottle labeled “thymol” on the stockroom shelf. After noticing a pleasant odor, she obtained the following mass, IR, and NMR spectra. The NMR peak at δ4.8 disappears on shaking with D2O. Propose a structure for thymol, and show how your structure is consistent with the spectra. Propose a fragmentation to explain the MS peak at m/z 135, and show why the resulting ion is relatively stable.
Expert Solution & Answer
Want to see the full answer?
Check out a sample textbook solution
Students have asked these similar questions
help
The temperature on a sample of pure X held at 1.25 atm and -54. °C is increased until the sample boils. The temperature is then held constant and the
pressure is decreased by 0.42 atm. On the phase diagram below draw a path that shows this set of changes.
pressure (atm)
2
0
0
200
400
temperature (K)
X
QUESTION: Answer Question 5: 'Calculating standard error of regression' STEP 1 by filling in all the empty green boxes
*The values are all provided in the photo attached*
Chapter 16 Solutions
ORGANIC CHEMISTRY
Ch. 16.2 - Prob. 16.1PCh. 16.2 - Prob. 16.2PCh. 16.2 - a. Draw the resonance forms of benzene,...Ch. 16.2 - Show the product of the Diels-Alder dimerization...Ch. 16.4 - Prob. 16.5PCh. 16.6 - Make a model of cyclooctatetraene in the tub...Ch. 16.6 - Prob. 16.7PCh. 16.6 - Prob. 16.8PCh. 16.7 - Prob. 16.9PCh. 16.8A - a. Draw the molecular orbitals for the...
Ch. 16.8A - Repeat Problem16-10 for the cyclopentadienyl ions....Ch. 16.8C - Explain why each compound or ion should be...Ch. 16.8C - The following hydrocarbon has an unusually large...Ch. 16.8C - Prob. 16.14PCh. 16.8C - Prob. 16.15PCh. 16.9B - Prob. 16.16PCh. 16.9C - Show which of the nitrogen atoms in purine are...Ch. 16.9C - The proton NMR spectrum of 2-pyridone gives the...Ch. 16.9D - Prob. 16.19PCh. 16.9D - Prob. 16.20PCh. 16.10 - Prob. 16.21PCh. 16.12 - Ciprofloxacin is a member of the fluoroquinolone...Ch. 16.13 - Draw and name all the chlorinated benzenes having...Ch. 16.13 - Name the following compounds:Ch. 16.15 - The UV spectrum of 1-phenylprop-2-en-1-ol shows an...Ch. 16 - Prob. 16.26SPCh. 16 - Name the following compounds:Ch. 16 - Draw and name all the methyl, dimethyl, and...Ch. 16 - Four pairs of compounds are shown. In each pair,...Ch. 16 - One of the following hydrocarbons is much more...Ch. 16 - In Kekuls time cyclohexane was unknown, and there...Ch. 16 - Prob. 16.32SPCh. 16 - Azulene is a deep-blue hydrocarbon with resonance...Ch. 16 - Prob. 16.34SPCh. 16 - Prob. 16.35SPCh. 16 - Prob. 16.36SPCh. 16 - Prob. 16.37SPCh. 16 - Prob. 16.38SPCh. 16 - Prob. 16.39SPCh. 16 - Biphenyl has the following structure. a. Is...Ch. 16 - Anions of hydrocarbons are rare, and dianions of...Ch. 16 - How would you convert the following compounds to...Ch. 16 - Prob. 16.43SPCh. 16 - Prob. 16.44SPCh. 16 - A student found an old bottle labeled thymol on...Ch. 16 - Prob. 16.46SPCh. 16 - Prob. 16.47SPCh. 16 - Prob. 16.48SPCh. 16 - The proton NMR chemical shifts of the hydrogens in...Ch. 16 - Prob. 16.50SPCh. 16 - NMR has been used to probe many molecular...
Knowledge Booster


Learn more about
Need a deep-dive on the concept behind this application? Look no further. Learn more about this topic, chemistry and related others by exploring similar questions and additional content below.Similar questions
- pressure (atm) 3 The pressure on a sample of pure X held at 47. °C and 0.88 atm is increased until the sample condenses. The pressure is then held constant and the temperature is decreased by 82. °C. On the phase diagram below draw a path that shows this set of changes. 0 0 200 temperature (K) 400 аarrow_forwarder your payment details | bar xb Home | bartleby x + aleksogi/x/isl.exe/1o u-lgNskr7j8P3jH-1Qs_pBanHhviTCeeBZbufuBYT0Hz7m7D3ZcW81NC1d8Kzb4srFik1OUFhKMUXzhGpw7k1 O States of Matter Sketching a described thermodynamic change on a phase diagram 0/5 The pressure on a sample of pure X held at 47. °C and 0.88 atm is increased until the sample condenses. The pressure is then held constant and the temperature is decreased by 82. °C. On the phase diagram below draw a path that shows this set of changes. pressure (atm) 1 3- 0- 0 200 Explanation Check temperature (K) 400 X Q Search L G 2025 McGraw Hill LLC. All Rights Reserved Terms of Use Privacy Cearrow_forward5.arrow_forward
- 6.arrow_forward0/5 alekscgi/x/sl.exe/1o_u-IgNglkr7j8P3jH-IQs_pBaHhvlTCeeBZbufuBYTi0Hz7m7D3ZcSLEFovsXaorzoFtUs | AbtAURtkqzol 1HRAS286, O States of Matter Sketching a described thermodynamic change on a phase diagram The pressure on a sample of pure X held at 47. °C and 0.88 atm is increased until the sample condenses. The pressure is then held constant and the temperature is decreased by 82. °C. On the phase diagram below draw a path that shows this set of changes. 3 pressure (atm) + 0- 0 5+ 200 temperature (K) 400 Explanation Check X 0+ F3 F4 F5 F6 F7 S 2025 McGraw Hill LLC All Rights Reserved. Terms of Use Privacy Center Accessibility Q Search LUCR + F8 F9 F10 F11 F12 * % & ( 5 6 7 8 9 Y'S Dele Insert PrtSc + Backsarrow_forward5.arrow_forward
- 9arrow_forwardalekscgi/x/lsl.exe/1o_u-IgNslkr7j8P3jH-IQs_pBanHhvlTCeeBZbufu BYTI0Hz7m7D3ZS18w-nDB10538ZsAtmorZoFusYj2Xu9b78gZo- O States of Matter Sketching a described thermodynamic change on a phase diagram 0/5 The pressure on a sample of pure X held at 47. °C and 0.88 atm is increased until the sample condenses. The pressure is then held constant and the temperature is decreased by 82. °C. On the phase diagram below draw a path that shows this set of changes. pressure (atm) 3- 200 temperature (K) Explanation Chick Q Sowncharrow_forward0+ aleksog/x/lsl.exe/1ou-lgNgkr7j8P3H-IQs pBaHhviTCeeBZbufuBYTOHz7m7D3ZStEPTBSB3u9bsp3Da pl19qomOXLhvWbH9wmXW5zm O States of Matter Sketching a described thermodynamic change on a phase diagram 0/5 Gab The temperature on a sample of pure X held at 0.75 atm and -229. °C is increased until the sample sublimes. The temperature is then held constant and the pressure is decreased by 0.50 atm. On the phase diagram below draw a path that shows this set of changes. F3 pressure (atm) 0- 0 200 Explanation temperature (K) Check F4 F5 ☀+ Q Search Chill Will an 9 ENG F6 F7 F8 F9 8 Delete F10 F11 F12 Insert PrtSc 114 d Ararrow_forward
- x + LEKS: Using a phase diagram a X n/alekscgi/x/lsl.exe/10_u-IgNsikr7j8P3jH-IQs_pBan HhvlTCeeBZbufu BYTI0Hz7m7D3ZcHYUt80XL-5alyVpw ○ States of Matter Using a phase diagram to find a phase transition temperature or pressure Use the phase diagram of Substance X below to find the melting point of X when the pressure above the solid is 1.1 atm. pressure (atm) 16 08- solid liquid- 0 200 400 gas 600 temperature (K) Note: your answer must be within 25 °C of the exact answer to be graded correct. × 5arrow_forwardS: Using a phase diagram leksogi/x/sl.exe/1ou-IgNs kr 7j8P3jH-IQs_pBan HhvTCeeBZbufuBYTI0Hz7m7D3ZdHYU+80XL-5alyVp O States of Matter Using a phase diagram to find a phase transition temperature or pressure se the phase diagram of Substance X below to find the boiling point of X when the pressure on the liquid is 1.6 atm. pressure (atm) 32- 16- solid liquid 0. gas 100 200 temperature (K) 300 Note: your answer must be within 12.5 °C of the exact answer to be graded correct. 10 Explanation Check § Q Search J 2025 McGraw Hill LLC. All Rights Researrow_forward151.2 254.8 85.9 199.6 241.4 87.6 242.5 186.4 155.8 257.1 242.9 253.3 256.0 216.6 108.7 239.0 149.7 236.4 152.1 222.7 148.7 278.2 268.7 234.4 262.7 283.2 143.6 QUESTION: Using this group of data on salt reduced tomato sauce concentration readings answer the following questions: 1. 95% Cl Confidence Interval (mmol/L) 2. [Na+] (mg/100 mL) 3. 95% Na+ Confidence Interval (mg/100 mL)arrow_forward
arrow_back_ios
SEE MORE QUESTIONS
arrow_forward_ios
Recommended textbooks for you
 Organic ChemistryChemistryISBN:9781305580350Author:William H. Brown, Brent L. Iverson, Eric Anslyn, Christopher S. FootePublisher:Cengage Learning
Organic Chemistry
Chemistry
ISBN:9781305580350
Author:William H. Brown, Brent L. Iverson, Eric Anslyn, Christopher S. Foote
Publisher:Cengage Learning
NMR Spectroscopy; Author: Professor Dave Explains;https://www.youtube.com/watch?v=SBir5wUS3Bo;License: Standard YouTube License, CC-BY