
Concept explainers
Videos
a.
To complete: The function table for the values of length and breadth for the area of rectangle to
a.
Answer to Problem 15PPS
The function table for the values of length and breadth for the area of rectangle to be
Explanation of Solution
Given information:
The area of rectangle is
Formula:
Area of rectangle is
Calculation:
Consider the area of rectangle has
Recall that area of rectangle is
Therefore the possible lengths and widths of the rectangle for an area to be
b.
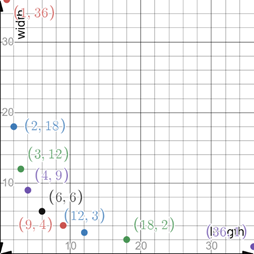
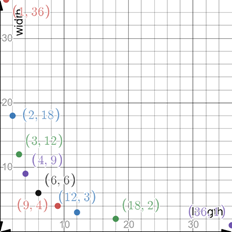
To graph: The ordered pairs of the function table mentioned below.
b.
Answer to Problem 15PPS
The graph mentioned below represents x axis as length and y axis as width.
Explanation of Solution
Given information:
The function table is mentioned below.
Graph:
The graph plotted below represents x axis as length and y axis as width.
Interpretation:
Consider the statement to graph the function table as mentioned below.
Recall that the function table is
Here we consider length as x axis and width as y axis.
Therefore the graph we observed above is the graph of function table.
Chapter 1 Solutions
Pre-Algebra Student Edition
Additional Math Textbook Solutions
Using and Understanding Mathematics: A Quantitative Reasoning Approach (6th Edition)
Calculus: Early Transcendentals (2nd Edition)
Elementary Statistics (13th Edition)
Calculus: Early Transcendentals (2nd Edition)
Thinking Mathematically (6th Edition)
A Problem Solving Approach To Mathematics For Elementary School Teachers (13th Edition)


- (a) (b) (c) (d) de unique? Answer the following questions related to the linear system x + y + z = 2 x-y+z=0 2x + y 2 3 rewrite the linear system into the matrix-vector form A = 5 Fuse elementary row operation to solve this linear system. Is the solution use elementary row operation to find the inverse of A and then solve the linear system. Verify the solution is the same as (b). give the null space of matrix A and find the dimension of null space. give the column space of matrix A and find the dimension of the column space of A (Hint: use Rank-Nullity Theorem).arrow_forwardplease explain in a clear wayarrow_forwardSolve questions by Course Name Ordinary Differential Equationsarrow_forward
- Determine whether it's true or false and the reasoning is neededarrow_forward1. (20 pts) Determine whether the following statements are true (T) or false (F)? (A reasoning is required.) (1) Let V be the set of all ordered pairs of real numbers. Consider the following addition and scalar multiplication operations on u = u= (u1, u2) and v = (v1, v2): u + v = (U₁ + V₁, U₂ + v₂), ku = (ku₁, u₂). Is V a vector space under the above operations? U2 (2) The set Mmxn of all m×n matrices with the usual operations of addition and scalar multiplication is a vector space. α (3) The dimension of the vector space of all matrices A = [a b] in R2×2 with a+d=0 is 4. (4) The coordinate vector of p(x) = 2-x+x² in P3 relative to the basis S = {1, 1+x, x + x2} is [4 -2 1]. (5) If a 6×4 matrix A has a rank 3, then the dimension of N(A) is 3.arrow_forward5. (20%) The linear transformation L: P3 → P2 defined by L(f(x)) = f'(x)+ f(0). (a) Find the representing matrix A of L with respect to the ordered basis {x2, x, 1} for P3, and the ordered basis {2,1 - x} for P2. (b) Find the coordinates of the f(x) = 2x² +2 in P3 with respect to the ordered basis {x2,-x, 1}, and find the coordinates of L(f(x)) with respect to the ordered basis {2,1-x}arrow_forward
- For the spinner below, assume that the pointer can never lie on a borderline. Find the following probabilities. (enter the probabilities as fractions)arrow_forwardQuestions 1. Identify and describe potential bias in the study. 2. Identify and describe the way in which the selected participants may or may not represent the population as a whole. 3. Identify and describe the possible problems with the end results since the majority will be from females rather than an even split. 4. Identify and describe the possible problems with identifying females as possibly more vulnerable based on the data collected. 5. Identify a possible null hypothesis and problems in how the study might address this null hypothesis. 6. Identify one possible method of improving the study design and describe how it would improve the validity of the conclusions. 7. Identify a second possible method of improving the study design and describe how it would improve the validity of the conclusions.arrow_forwardThe Course Name Real Analysis please Solve questions by Real Analysisarrow_forward
- part 3 of the question is: A power outage occurs 6 min after the ride started. Passengers must wait for their cage to be manually cranked into the lowest position in order to exit the ride. Sine function model: where h is the height of the last passenger above the ground measured in feet and t is the time of operation of the ride in minutes. What is the height of the last passenger at the moment of the power outage? Verify your answer by evaluating the sine function model. Will the last passenger to board the ride need to wait in order to exit the ride? Explain.arrow_forward2. The duration of the ride is 15 min. (a) How many times does the last passenger who boarded the ride make a complete loop on the Ferris wheel? (b) What is the position of that passenger when the ride ends?arrow_forward3. A scientist recorded the movement of a pendulum for 10 s. The scientist began recording when the pendulum was at its resting position. The pendulum then moved right (positive displacement) and left (negative displacement) several times. The pendulum took 4 s to swing to the right and the left and then return to its resting position. The pendulum's furthest distance to either side was 6 in. Graph the function that represents the pendulum's displacement as a function of time. Answer: f(t) (a) Write an equation to represent the displacement of the pendulum as a function of time. (b) Graph the function. 10 9 8 7 6 5 4 3 2 1 0 t 1 2 3 4 5 6 7 8 9 10 11 12 13 14 15 -1 -5. -6 -7 -8 -9 -10-arrow_forward
 Algebra and Trigonometry (6th Edition)AlgebraISBN:9780134463216Author:Robert F. BlitzerPublisher:PEARSON
 Contemporary Abstract AlgebraAlgebraISBN:9781305657960Author:Joseph GallianPublisher:Cengage Learning
 Linear Algebra: A Modern IntroductionAlgebraISBN:9781285463247Author:David PoolePublisher:Cengage Learning
 Algebra And Trigonometry (11th Edition)AlgebraISBN:9780135163078Author:Michael SullivanPublisher:PEARSON
 Introduction to Linear Algebra, Fifth EditionAlgebraISBN:9780980232776Author:Gilbert StrangPublisher:Wellesley-Cambridge Press
 College Algebra (Collegiate Math)AlgebraISBN:9780077836344Author:Julie Miller, Donna GerkenPublisher:McGraw-Hill Education