
Concept explainers
Videos
a.
To construct: The table which shows the x values and y values.
a.
Answer to Problem 13PPS
Explanation of Solution
Given information:
The

Formula:
Use of value of x and value of y from the scatter plot.
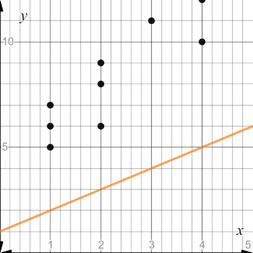
Consider the scatter plot as mentioned above.
Recall that we have to use value of x and value of y from the scatter plot.
Therefore the ordered pair table is
b.
To write: The situation that could produce the data values shown in the scatter plot.
b.
Answer to Problem 13PPS
The situation occurred is that for some values of y the values of x is constant.
Explanation of Solution
Given information:
The scatter plot is mentioned below.

Formula:
Use of value of x and value of y from the scatter plot.
Consider the scatter plot as mentioned above.
Recall that we have to use value of x and value of y from the scatter plot.
Here from the scatter plot the situation occurred is that for some values of y the values of x is constant.
Therefore as the values shown in the scatter plot it describes the situation about for some values of y the values of x is constant.
c.
To explain: The relationship of the data shown on the scatter plot above.
c.
Answer to Problem 13PPS
There is no relationship shown by the scatter plot.
Explanation of Solution
Given information:
The scatter plot is mentioned below.
Formula:
If the values of x is constant and at the same time values of y is increasing then scatter plot shows no relationship.
Consider the scatter plot as mentioned above.
Recall that if the values of x is constant and at the same time values of y is increasing then scatter plot shows no relationship.
Here are some values of y where the values of x is constant.
Therefore from the scatter plot we can observe that there is no relationship.
Chapter 1 Solutions
Pre-Algebra Student Edition
Additional Math Textbook Solutions
Elementary Statistics (13th Edition)
A Problem Solving Approach To Mathematics For Elementary School Teachers (13th Edition)
Intro Stats, Books a la Carte Edition (5th Edition)
Calculus: Early Transcendentals (2nd Edition)
A First Course in Probability (10th Edition)


- Evaluate the following expression and show your work to support your calculations. a). 6! b). 4! 3!0! 7! c). 5!2! d). 5!2! e). n! (n - 1)!arrow_forwardAmy and Samiha have a hat that contains two playing cards, one ace and one king. They are playing a game where they randomly pick a card out of the hat four times, with replacement. Amy thinks that the probability of getting exactly two aces in four picks is equal to the probability of not getting exactly two aces in four picks. Samiha disagrees. She thinks that the probability of not getting exactly two aces is greater. The sample space of possible outcomes is listed below. A represents an ace, and K represents a king. Who is correct?arrow_forwardConsider the exponential function f(x) = 12x. Complete the sentences about the key features of the graph. The domain is all real numbers. The range is y> 0. The equation of the asymptote is y = 0 The y-intercept is 1arrow_forward
- The graph shows Alex's distance from home after biking for x hours. What is the average rate of change from -1 to 1 for the function? 4-2 о A. -2 О B. 2 О C. 1 O D. -1 ty 6 4 2 2 0 X 2 4arrow_forwardWrite 7. √49 using rational exponents. ○ A. 57 47 B. 7 O C. 47 ○ D. 74arrow_forwardCan you check If my short explantions make sense because I want to make sure that I describe this part accuratelyarrow_forward
- 9! is 362, 880. What is 10!?arrow_forwardBruce and Krista are going to buy a new furniture set for their living room. They want to buy a couch, a coffee table, and a recliner. They have narrowed it down so that they are choosing between \[4\] couches, \[5\] coffee tables, and \[9\] recliners. How many different furniture combinations are possible?arrow_forwardCan you check if my step is correct?arrow_forward
 Algebra and Trigonometry (6th Edition)AlgebraISBN:9780134463216Author:Robert F. BlitzerPublisher:PEARSON
 Contemporary Abstract AlgebraAlgebraISBN:9781305657960Author:Joseph GallianPublisher:Cengage Learning
 Linear Algebra: A Modern IntroductionAlgebraISBN:9781285463247Author:David PoolePublisher:Cengage Learning
 Algebra And Trigonometry (11th Edition)AlgebraISBN:9780135163078Author:Michael SullivanPublisher:PEARSON
 Introduction to Linear Algebra, Fifth EditionAlgebraISBN:9780980232776Author:Gilbert StrangPublisher:Wellesley-Cambridge Press
 College Algebra (Collegiate Math)AlgebraISBN:9780077836344Author:Julie Miller, Donna GerkenPublisher:McGraw-Hill Education