
Concept explainers
Videos
a.
To graph: The
a.
Explanation of Solution
Given information:
The data is provided below.
Graph:
When the relationship between two data sets is to be analyzed scatter plot is used.
Provided two data sets month and average temperature during that month. The data is provided below.
On the x -axis of coordinate plane denote the month from 1 to 12 as data is from January to December.
On y -axis plot the average temperature in
The scatter plot of the data is provided below,
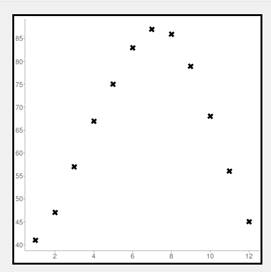
Interpretation:
It is observed that first the temperature increases till month of July and then it starts to decrease gradually that is there is a strong nonlinear relationship between x and y .
b.
To describe: The scatter plot between the different months and average temperature for Louisville, Kentucky.
b.
Answer to Problem 11PPS
The scatter plot between the month and average temperature shows a strong nonlinear relationship.
Explanation of Solution
Given information:
The data is provided below.
When the relationship between two data sets is to be analyzed scatter plot is used.
Provided two data sets,
Initially the temperature rises from 41 to 987 degree Fahrenheit till month of July so till here the relationship is positive after the month of July the temperature falls to 45 degrees Fahrenheit in December depicting a negative relationship. So, it can be said that the data portrays a strong nonlinear relationship.
Thus, the scatter plot between the month and average temperature shows a strong nonlinear relationship.
Chapter 1 Solutions
Pre-Algebra Student Edition
Additional Math Textbook Solutions
Basic Business Statistics, Student Value Edition
Introductory Statistics
College Algebra with Modeling & Visualization (5th Edition)
University Calculus: Early Transcendentals (4th Edition)
Algebra and Trigonometry (6th Edition)
Elementary Statistics: Picturing the World (7th Edition)


- A professor gives two types of quizzes, objective and recall. He plans to give at least 15 quizzes this quarter. The student preparation time for an objective quiz is 15 minutes and for a recall quiz 30 minutes. The professor would like a student to spend at least 5 hours total (300 minutes) preparing for these quizzes. It takes the professor 1 minute to grade an objective quiz, and 1.5 minutes to grade a recall type quiz. How many of each type of quiz should the professor give in order to minimize his grading time (why still meeting the other requirements outlined)?arrow_forwardTable 15-21 shows the relative frequencies of the scores of a group of students on a philosophy quiz.Table 15-21 Score45678 Relative frequency7%11%19%24%39%arrow_forwardInstructions: Answer each question showing all work. 1. Out of 30 animals at a veterinarian clinic, 8 cats and 4 dogs have been vaccinated. 6 cats and 12 dogs are not yet vaccinated. Create a two-way frequency table to represent the data. 2. Convert the table from number 1 into a two-way relative frequency table. Instructions: Based on the tables created in questions 1 and 2 above, answer questions 3-7. 3. What percentage of cats from the total animals are vaccinated? 4. What is the relative frequency of dogs from the total animals that are not yet vaccinated? 5. What is the conditional frequency of cats that have not been vaccinated? 6. What is the marginal frequency of the total number of animals vaccinated? 7. What is the joint frequency of the cats that are vaccinated?arrow_forward
- The the high 3000arrow_forwardHow long will it take you to double your money if you invest it at a rate of 8% compounded annually?arrow_forwardOne hundred dollars is invested at 7.2% interest compounded annually. Determine how much the investment is worth after: a. I year b. 5 years c. 10 years d. 20 years e. Use your answers to parts (a)-(d) to estimate the doubling time for the investment.arrow_forward
- 6) A farmer has 60 acres on which to plant oats or corn. Each acre of oats requires 100 lbs of fertilizer and 1 hour of labor. Each acre of corn requires 50 lbs of fertilizer and 2 hours of labor. The farmer has 5000 lbs of fertilizer and 100 hours available for labor. If the profit is $60 from each acre of oats and $100 from each acre of corn, what planting combination will produce the greatest total profit? a) Fill in the following chart to help organize the information given in the problem: Oats Labor Fertilizer Land Profit b) Write down the question of interest. Corn Available c) Define variables to answer the question of interest. Call these x and y. d) Write the objective function to answer the question of interest. e) List any constraints given in the problem.arrow_forwardI need help with number 5.arrow_forward3) Use the following system of linear inequalities graphed below to answer the questions. a) Use the graph to write the symbolic form of the system of linear inequalities. b) Is (-4,2) a solution to the system? Explain. 5 -7 -5 -3 -2 0 2 3 4 $ 6 -2 -6 -7arrow_forward
- ) Graph the feasible region subject to the following constraints. x + y ≤ 6 y ≤ 2x x ≥ 0, y ≥ 0 P + xarrow_forwardSolve the following system of equations: 50x+20y=1800 10x+3y=300arrow_forward> > > we are hiring Salesforce Admin Location: Remote Key Responsibilities: Administer Salesforce Sales & Revenue Cloud (CPQ & Billing) Configure workflows, validation rules & dashboards Automate processes using Flows & Process Builder Collaborate with Sales, Finance & Marketing teams Manage user roles & security Apply: Hr@forcecraver.comarrow_forward
 Algebra and Trigonometry (6th Edition)AlgebraISBN:9780134463216Author:Robert F. BlitzerPublisher:PEARSON
 Contemporary Abstract AlgebraAlgebraISBN:9781305657960Author:Joseph GallianPublisher:Cengage Learning
 Linear Algebra: A Modern IntroductionAlgebraISBN:9781285463247Author:David PoolePublisher:Cengage Learning
 Algebra And Trigonometry (11th Edition)AlgebraISBN:9780135163078Author:Michael SullivanPublisher:PEARSON
 Introduction to Linear Algebra, Fifth EditionAlgebraISBN:9780980232776Author:Gilbert StrangPublisher:Wellesley-Cambridge Press
 College Algebra (Collegiate Math)AlgebraISBN:9780077836344Author:Julie Miller, Donna GerkenPublisher:McGraw-Hill Education