
Videos
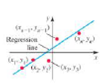
Least squares approximation In its many guises, least squares approximation arises in numerous areas of mathematics and statistics. Suppose you collect data for two variables (for example, height and shoe size) in the form of pairs (x1, y1), (x2, y2), …., (xn, yn). The data may be plotted as a
•
75. Generalize the procedure in Exercise 74 by assuming n data points (x1, y1), (x2, y2), …, (xn, yn) are given. Write the function E(m, b) (summation notation allows for a more compact calculation). Show that the coefficients of the best-fit line are
where all sums run from k = 1 to k = n
Want to see the full answer?
Check out a sample textbook solution
Chapter 15 Solutions
EP CALCULUS:EARLY TRANS.-MYLABMATH 18 W
Additional Math Textbook Solutions
Thinking Mathematically (6th Edition)
Calculus for Business, Economics, Life Sciences, and Social Sciences (14th Edition)
Calculus: Early Transcendentals (2nd Edition)
Elementary Statistics
Intro Stats, Books a la Carte Edition (5th Edition)


- Solve please and thank you!arrow_forwardSolve please and thanks!arrow_forwardThe graph of the function f in the figure below consists of line segments and a semicircle. Let g be the function given by x 9(x) = * f(t)dt. Determine all values of r, if any, where g has a relative minimum on the open interval (-9, 9). y 8 7 6 5 4 32 1 Graph of f x -10 -9 -8 -7 -6 -5 -4 -3 -2 -1 1 2 3 4 5 6 7 8 9 10 -1 -2 -3 -4 -5 -6 678 -7 -8arrow_forward
- Solve pleasearrow_forwardA particle moves along the x-axis for 0 < t < 18 such that its velocity is given by the graph shown below. Find the total distance traveled by the particle during the time interval 4 ≤ t ≤ 8. 8 y 7 6 5 4 32 1 6 7 -1 1 2 3 4 5 -1 -2 -3 -4 56 -6 -8 8 00 Graph of v(t) x 9 10 11 12 13 14 15 16 17 18 19arrow_forwardUsing the Chain rule please and thank youarrow_forward
- 10. [-/3 Points] DETAILS MY NOTES SESSCALCET2 7.2.047. Consider the following. aR- br (a) Set up an integral for the volume a solid torus (the donut-shaped solid shown in the figure) with radii br and aR. (Let a 8 and b = 2.) = dy (b) By interpreting the integral as an area, find the volume V of the torus. V = Need Help? Read It Watch Itarrow_forwardGraph y= log(x − 1) +4 10+ 9 8 7 6 5 4 32 1 10 -9 -8 -7 -6 -5 -4 -3 -2 -1 1 2 3 4 5 -1 6 7 8 9 10 -2 -3 -4 -5 -6 -7 -8 -9 -10arrow_forwardWrite an equation for the graph shown below. 5 4 3 2 1 -5-4-3-2-1 -1 1 2 3 4 5 f(x) = -2 -3 -4 -5arrow_forward
- 1. We want to graph the function f(x) log4 x. In a table below, = find at three points with nice integer y-values (no rounding!) and then graph the function at right. Be sure to clearly indicate any asymptotes. (4 points) 3 2 1- -1 0 1 2 3 4 5 10 X log4(x) -1 -2 -3- 6 7 8 00arrow_forwardGraph y=log2(x+3) 10+ 9 8 7- 6 5 4 3 3 2 1 10 -9 -8 -7 -6 -5 -4 -3-2-1 1 2 3 4 5 6 7 8 7 8 9 10 -1 -2 -3 -4 -5 -6 -7- -8 -9 -10 Clear All Drawarrow_forwardWrite an equation for the graph below. +10+ 9 10 -9 -8 -7 -6 -5 -4 -3-2-1 8 7 6 5 4 3 2 1 1 3 4 5 6 7 8 9 10 -1 -2 -3 -4 -5 -6 -7 -8 f(x) = 9 -9 -10-arrow_forward
 Elementary Linear Algebra (MindTap Course List)AlgebraISBN:9781305658004Author:Ron LarsonPublisher:Cengage Learning
 Algebra & Trigonometry with Analytic GeometryAlgebraISBN:9781133382119Author:SwokowskiPublisher:Cengage