Mathematics for Elementary Teachers with Activities, Books a la carte edition (5th Edition)
5th Edition
ISBN: 9780134423319
Author: Sybilla Beckmann
Publisher: PEARSON
expand_more
expand_more
format_list_bulleted
Concept explainers
Videos
Textbook Question
Chapter 15.4, Problem 9P
Determine the median and interquartile range for the amounts ofvitamin C found in each of the two different hypothetical brandsof vitamin pills shown in Figure 15.38. For each brand, 40samples were tested.Then use the medians and interquartileranges to compare the two brands of vitamins.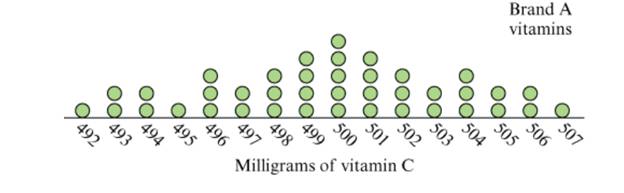
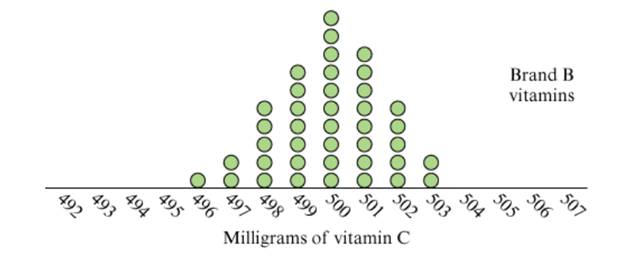
Figure 15.38 Amount of vitamin C found in hypotheticalsamples of two different brands of vitamin pills.
Expert Solution & Answer
Want to see the full answer?
Check out a sample textbook solution
Students have asked these similar questions
Consider the grades for the math and history exams for 10 students on a scale from 0 to 12 in the following table.
Student
Math
History
1
4
8
2
5
9
3
7
9
4
12
10
5
10
8
6
8
5
7
9
6
8
9
6
9
11
9
10
7
10
Compute the Spearman correlation coefficient. Round your answer to three decimal places.
Q4
3 Points
1
Let A =
2
3 7
5 11
Give one nontrivial solution X of the homogeneous system Ax = 0. (Your
vector x should have explicit numbers as its entries, as opposed to variables/parameters). Show
your work for how you found it.
Please select file(s) Select file(s)
Save Answer
To compare two elementary schools regarding teaching of reading skills, 12 sets of identical twins were used. In each case, one child was selected at random and sent to school A, and his or her twin was sent to school B. Near the end of fifth grade, an achievement test was given to each child. The results follow:
Twin Pair
1
2
3
4
5
6
School A
169
157
115
99
119
113
School B
123
157
112
99
121
122
Twin Pair
7
8
9
10
11
12
School A
120
121
124
145
138
117
School B
153
90
124
140
142
102
Suppose a sign test for matched pairs with a 1% level of significance is used to test the hypothesis that the schools have the same effectiveness in teaching reading skills against the alternate hypothesis that the schools have different levels of effectiveness in teaching reading skills. Let p denote portion of positive signs when the scores of school B are subtracted from the corresponding scores of school…
Chapter 15 Solutions
Mathematics for Elementary Teachers with Activities, Books a la carte edition (5th Edition)
Ch. 15.1 - Give two examples of a statistical question and...Ch. 15.1 - A class has a collection of 100 bottle caps and...Ch. 15.1 - Neil, a third-grader, asked 10 of his classmates...Ch. 15.1 - An announcer of a TV program invited viewers to...Ch. 15.1 - There is a bowl containing 300 plastic tiles. Some...Ch. 15.1 - There is a bowl containing 80 green tiles and an...Ch. 15.1 - At a factory that produces doorknobs, 1500...Ch. 15.1 - At a factory that produces switches, 3000 switches...Ch. 15.1 - At a light bulb factory, 1728 light bulbs are...Ch. 15.1 - Carter has a large collection of marbles. He knows...
Ch. 15.1 - The following problem is an example of the...Ch. 15.1 - A group studying violence wants to determine the...Ch. 15.2 - Three third-grade classes are having a contest to...Ch. 15.2 - Find 3 coins of any type (as long as all 3 have a...Ch. 15.2 - Table 15.3 shows women’s 400-meter freestyle...Ch. 15.2 - Using an Internet browser, go to census.gov, the...Ch. 15.2 - Using an Internet browser, go to the webpage of...Ch. 15.2 - Using an Internet browser, go to one of the...Ch. 15.2 - Using an Internet browser, go to one of the...Ch. 15.2 - a. Describe in detail an activity suitable for use...Ch. 15.3 - In your own words, explain why the following two...Ch. 15.3 - Explain why the mean of a list of numbers must...Ch. 15.3 - Explain why the mean of two numbers is exactly...Ch. 15.3 - Shante caught 17 ladybugs every day for 4 days....Ch. 15.3 - John’s average annual income over a 4-year period...Ch. 15.3 - Tracy’s times swimming 200 yards were as follows:...Ch. 15.3 - Explain how you can quickly calculate the mean of...Ch. 15.3 - Explain how you can quickly calculate the mean of...Ch. 15.3 - average on her first 3 math tests was 80. Her...Ch. 15.3 - A teacher gives a 10-point test to a class of 10...Ch. 15.3 - In your own words, describe how to view the mean...Ch. 15.3 - Discuss Jessica’s reasoning about calculating the...Ch. 15.3 - ]The dot plot in Figure 15.21 represents the...Ch. 15.3 - For each of the following situations, decide...Ch. 15.3 - A teacher gives a 10-point test to a class of 9...Ch. 15.3 - A teacher gives a 10-point test to a class of 9...Ch. 15.3 - In Ritzy County, the average annual household...Ch. 15.3 - In county A, the average score on the grade 5 Iowa...Ch. 15.3 - a. The histogram at the top of Figure 15.22 shows...Ch. 15.3 - * Ms. Smith needs to figure her students’ homework...Ch. 15.3 - The average speed of a moving object during a...Ch. 15.4 - What is the difference between scoring in the 90th...Ch. 15.4 - What is the purpose of reporting a student’s...Ch. 15.4 - The three histograms in Figure 15.37 show the...Ch. 15.4 - At a math center in a class, there is a bag filled...Ch. 15.4 - Refer to Figure 15.26 on page 706. a. Refer to the...Ch. 15.4 - Refer to Figure 15.26 on page 706. a. Refer to the...Ch. 15.4 - Refer to Figure 15.26 on page 706. a. Write at...Ch. 15.4 - Use the NAEP long-term trend data about...Ch. 15.4 - Determine the median and interquartile range for...Ch. 15.4 - a. Make a box plot for the data in Figure 15.38....Ch. 15.4 - Determine the medians and interquartile ranges for...Ch. 15.4 - a. Make box plots for the dot plots in Figure...Ch. 15.4 - A fifth-grade class is wondering ¡f girls’ names...Ch. 15.4 - Compute the mean and the MAD for each of the dot...Ch. 15.4 - On a state-wide test graded on a 10-point scale,...Ch. 15.4 - A 400-point test is given to a group of students....
Additional Math Textbook Solutions
Find more solutions based on key concepts
1. How much money is Joe earning when he’s 30?
Pathways To Math Literacy (looseleaf)
Is there a relationship between wine consumption and deaths from heart disease? The table gives data from 19 de...
College Algebra Essentials (5th Edition)
True or False The quotient of two polynomial expressions is a rational expression, (p. A35)
Precalculus
Complete each statement with the correct term from the column on the right. Some of the choices may not be used...
Intermediate Algebra (13th Edition)
147. Draining a tank Water drains from the conical tank shown in the accompanying figure at the rate .
a. What...
University Calculus
Teacher Salaries
The following data from several years ago represent salaries (in dollars) from a school distri...
Elementary Statistics: A Step By Step Approach
Knowledge Booster


Learn more about
Need a deep-dive on the concept behind this application? Look no further. Learn more about this topic, subject and related others by exploring similar questions and additional content below.Similar questions
- A horse trainer teaches horses to jump by using two methods of instruction. Horses being taught by method A have a lead horse that accompanies each jump. Horses being taught by method B have no lead horse. The table shows the number of training sessions required before each horse performed the jumps properly. Method A 25 23 39 29 37 20 Method B 41 21 46 42 24 44 Method A 45 35 27 31 34 49 Method B 26 43 47 32 40 Use a rank-sum test with a5% level of significance to test the claim that there is no difference between the training sessions distributions. If the value of the sample test statistic R, the rank-sum, is 150, calculate the P-value. Round your answer to four decimal places.arrow_forwardA data processing company has a training program for new salespeople. After completing the training program, each trainee is ranked by his or her instructor. After a year of sales, the same class of trainees is again ranked by a company supervisor according to net value of the contracts they have acquired for the company. The results for a random sample of 11 salespeople trained in the last year follow, where x is rank in training class and y is rank in sales after 1 year. Lower ranks mean higher standing in class and higher net sales. Person 1 2 3 4 5 6 x rank 8 11 2 4 5 3 y rank 7 10 1 3 2 4 Person 7 8 9 10 11 x rank 7 9 10 1 6 y rank 8 11 9 6 5 Using a 1% level of significance, test the claim that the relation between x and y is monotone (either increasing or decreasing). Verify that the Spearman rank correlation coefficient . This implies that the P-value lies between 0.002 and 0.01. State…arrow_forwardSand and clay studies were conducted at a site in California. Twelve consecutive depths, each about 15 cm deep, were studied and the following percentages of sand in the soil were recorded. 34.4 27.1 30.8 28.0 32.2 27.6 32.8 25.2 31.4 33.5 24.7 28.4 Converting this sequence of numbers to a sequence of symbols A and B, where A indicates a value above the median and B denotes a value below the median gives ABABABABAABB. Test the sequence for randomness about the median with a 5% level of significance. Verify that the number of runs is 10. What is the upper critical value c2? arrow_forward
- Sand and clay studies were conducted at a site in California. Twelve consecutive depths, each about 15 cm deep, were studied and the following percentages of sand in the soil were recorded. 34.4 27.1 30.8 28.0 32.2 27.6 32.8 25.2 31.4 33.5 24.7 28.4 Converting this sequence of numbers to a sequence of symbols A and B, where A indicates a value above the median and B denotes a value below the median gives ABABABABAABB. Test the sequence for randomness about the median with a 5% level of significance. Verify that the number of runs is 10. What is the upper critical value c2?arrow_forward29% of all college students major in STEM (Science, Technology, Engineering, and Math). If 46 college students are randomly selected, find the probability thata. Exactly 11 of them major in STEM. b. At most 12 of them major in STEM. c. At least 11 of them major in STEM. d. Between 11 and 15 (including 11 and 15) of them major in STEM.arrow_forwardSand and clay studies were conducted at a site in California. Twelve consecutive depths, each about 15 cm deep, were studied and the following percentages of sand in the soil were recorded. 27.3 34.6 30.6 27.8 33.4 31.5 27.3 31.2 32.0 24.7 24.4 28.2 Test this sequence for randomness about the median. Converting this sequence of numbers to a sequence of symbols A and B, where A indicates a value above the median and B denotes a value below the median gives BAABAABAABBB. Verify that the number of runs is 7, the lower critical number is 3, and the upper critical number is 11. Use a 5% level of significance. State the conclusion of the test and interpret your results.arrow_forward
- 29% of all college students major in STEM (Science, Technology, Engineering, and Math). If 46 college students are randomly selected, find the probability thata. Exactly 11 of them major in STEM. b. At most 12 of them major in STEM. c. At least 11 of them major in STEM. d. Between 11 and 15 (including 11 and 15) of them major in STEM.arrow_forward4. Assume that a risk-free money market account is added to the market described in Q3. The continuously compounded rate of return on the money market account is log (1.1). (i) For each given μ, use Lagrange multipliers to determine the proportions (as a function of μ) of wealth invested in the three assets available for the minimum variance portfolio with expected return μ. (ii) Determine the market portfolio in this market and calculate its Sharp ratio.arrow_forward3. A market consists of two risky assets with rates of return R₁ and R2 and no risk-free asset. From market data the following have been estimated: ER₁ = 0.25, ER2 = 0.05, Var R₁ = 0.01, Var R2 = 0.04 and the correlation between R1 and R2 is p = -0.75. (i) Given that an investor is targeting a total expected return of μ = 0.2. What portfolio weights should they choose to meet this goal with minimum portfolio variance? Correct all your calculations up to 4 decimal points. (ii) Determine the global minimum-variance portfolio and the expected return and variance of return of this portfolio (4 d.p.). (iii) Sketch the minimum-variance frontier in the μ-σ² plane and indicate the efficient frontier. (iv) Without further calculation, explain how the minimum variance of the investor's portfolio return will change if the two risky assets were independent.arrow_forward
- 2. A landlord is about to write a rental contract for a tenant which lasts T months. The landlord first decides the length T > 0 (need not be an integer) of the contract, the tenant then signs it and pays an initial handling fee of £100 before moving in. The landlord collects the total amount of rent erT at the end of the contract at a continuously compounded rate r> 0, but the contract stipulates that the tenant may leave before T, in which case the landlord only collects the total rent up until the tenant's departure time 7. Assume that 7 is exponentially distributed with rate > 0, λ‡r. (i) Calculate the expected total payment EW the landlord will receive in terms of T. (ii) Assume that the landlord has logarithmic utility U(w) = log(w - 100) and decides that the rental rate r should depend on the contract length T by r(T) = λ √T 1 For each given λ, what T (as a function of X) should the landlord choose so as to maximise their expected utility? Justify your answer. Hint. It might be…arrow_forwardPlease solving problem2 Problem1 We consider a two-period binomial model with the following properties: each period lastsone (1) year and the current stock price is S0 = 4. On each period, the stock price doubleswhen it moves up and is reduced by half when it moves down. The annual interest rateon the money market is 25%. (This model is the same as in Prob. 1 of HW#2).We consider four options on this market: A European call option with maturity T = 2 years and strike price K = 5; A European put option with maturity T = 2 years and strike price K = 5; An American call option with maturity T = 2 years and strike price K = 5; An American put option with maturity T = 2 years and strike price K = 5.(a) Find the price at time 0 of both European options.(b) Find the price at time 0 of both American options. Compare your results with (a)and comment.(c) For each of the American options, describe the optimal exercising strategy.arrow_forwardPlease ensure that all parts of the question are answered thoroughly and clearly. Include a diagram to help explain answers. Make sure the explanation is easy to follow. Would appreciate work done written on paper. Thank you.arrow_forward
arrow_back_ios
SEE MORE QUESTIONS
arrow_forward_ios
Recommended textbooks for you
 Big Ideas Math A Bridge To Success Algebra 1: Stu...AlgebraISBN:9781680331141Author:HOUGHTON MIFFLIN HARCOURTPublisher:Houghton Mifflin Harcourt
 Holt Mcdougal Larson Pre-algebra: Student Edition...AlgebraISBN:9780547587776Author:HOLT MCDOUGALPublisher:HOLT MCDOUGAL
 Glencoe Algebra 1, Student Edition, 9780079039897...AlgebraISBN:9780079039897Author:CarterPublisher:McGraw Hill
 College Algebra (MindTap Course List)AlgebraISBN:9781305652231Author:R. David Gustafson, Jeff HughesPublisher:Cengage Learning
 Functions and Change: A Modeling Approach to Coll...AlgebraISBN:9781337111348Author:Bruce Crauder, Benny Evans, Alan NoellPublisher:Cengage Learning
Big Ideas Math A Bridge To Success Algebra 1: Stu...
Algebra
ISBN:9781680331141
Author:HOUGHTON MIFFLIN HARCOURT
Publisher:Houghton Mifflin Harcourt
Holt Mcdougal Larson Pre-algebra: Student Edition...
Algebra
ISBN:9780547587776
Author:HOLT MCDOUGAL
Publisher:HOLT MCDOUGAL
Glencoe Algebra 1, Student Edition, 9780079039897...
Algebra
ISBN:9780079039897
Author:Carter
Publisher:McGraw Hill
College Algebra (MindTap Course List)
Algebra
ISBN:9781305652231
Author:R. David Gustafson, Jeff Hughes
Publisher:Cengage Learning
Functions and Change: A Modeling Approach to Coll...
Algebra
ISBN:9781337111348
Author:Bruce Crauder, Benny Evans, Alan Noell
Publisher:Cengage Learning
The Shape of Data: Distributions: Crash Course Statistics #7; Author: CrashCourse;https://www.youtube.com/watch?v=bPFNxD3Yg6U;License: Standard YouTube License, CC-BY
Shape, Center, and Spread - Module 20.2 (Part 1); Author: Mrmathblog;https://www.youtube.com/watch?v=COaid7O_Gag;License: Standard YouTube License, CC-BY
Shape, Center and Spread; Author: Emily Murdock;https://www.youtube.com/watch?v=_YyW0DSCzpM;License: Standard Youtube License