Concept explainers
Videos
To graph: The
Explanation of Solution
Given information:
The data of Price of Precious Metals for 7 consecutive months is provided below,
Graph:
Consider the data of Price of Precious Metals for 7 consecutive months that is provided below,
On the Cartesian plane, the x -axis represent price of gold in dollars and y -axis denote the price of platinum in dollars.
Plot the ordered pairs on the Cartesian plane.
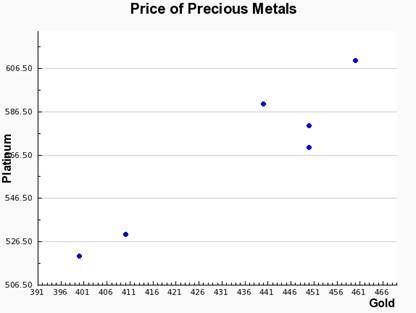
Interpretation:
It is observed that as the price of gold increase the price of platinum also increases. Points seems to be collinear.
Therefore, there is a high
Chapter 15 Solutions
Algebra and Trigonometry: Structure and Method, Book 2
Additional Math Textbook Solutions
Elementary Statistics
A Problem Solving Approach To Mathematics For Elementary School Teachers (13th Edition)
Introductory Statistics
Algebra and Trigonometry (6th Edition)
College Algebra with Modeling & Visualization (5th Edition)


- Consider the table of values below. x y 2 64 3 48 4 36 5 27 Fill in the right side of the equation y= with an expression that makes each ordered pari (x,y) in the table a solution to the equation.arrow_forwardsolving for xarrow_forwardConsider the table of values below. x y 2 63 3 70 4 77 5 84 Fill in the right side of the equation y= with an expression that makes each ordered pari (x,y) in the table a solution to the equation.arrow_forward
- There were 426 books sold in one week. The number of biology books sold was 5 times that of the number of psychology books. How many books each were sold?arrow_forwardPopulation decreases 5% each year. Starts with a starting population of 3705. Find that population after 5 years.arrow_forwardsolve using substitution -2x-3y=-15 -3x+9y=12arrow_forward
- Suppose that 7000 is placed in an accout that pays 4% interest. Interest compunds each year. Assume that no withdraws are made. How much would the account have after 1 year? And how much would the account have after 2 years?arrow_forwardUse substitution to solve the equations -2x+5y=18 x=2y-8arrow_forward5) For each function represented by an equation, make a table and plot the corresponding points to sketch the graph of the function. (a) y = 75 ()* 220 X y 200- -2 180 160 -1 140 0 120 100 1 60 80 2 3 4 x (b) y = 20 ()* 1 60 40 20 20 0 2 3 65- -1 X y 60 -2 55- 50 45 44 40 0 35- 30 1 25 2 20 20 15 3 10 5 LO 4 3-2 T -1 0 5- 4- -3- 2-arrow_forward
- A system of inequalities is shown. y 5 3 2 1 X -5 -4 -3 -2 -1 0 1 2 3 4 5 -1- Which system is represented in the graph? Oy>-x²-x+1 y 2x²+3 -2 -3 тarrow_forwardWhich set of systems of equations represents the solution to the graph? -5 -4 -3 -2 Of(x) = x² + 2x + 1 g(x) = x²+1 f(x) = x²+2x+1 g(x) = x²-1 f(x) = −x² + 2x + 1 g(x) = x²+1 f(x) = x² + 2x + 1 g(x) = x²-1 -1 5 y 4 3 2 1 0 -1- -2 -3- -4. -5 1 2 3 4 5arrow_forwardWhich of the graphs below correctly solves for x in the equation -x² - 3x-1=-x-4? о 10 8 (0,2) -10 -8 -6 -2 2 4 6 8 10 (-4,-2) -2 + (0,2) (4,6) -10-8-6-4-2 -2 2 4 6 8 10 (-3, -1) -2 2 (1-5) -6 -8 -10 10 -10-8-6-4-2 2 6 8 10 (2,0)arrow_forward
 Algebra and Trigonometry (6th Edition)AlgebraISBN:9780134463216Author:Robert F. BlitzerPublisher:PEARSON
 Contemporary Abstract AlgebraAlgebraISBN:9781305657960Author:Joseph GallianPublisher:Cengage Learning
 Linear Algebra: A Modern IntroductionAlgebraISBN:9781285463247Author:David PoolePublisher:Cengage Learning
 Algebra And Trigonometry (11th Edition)AlgebraISBN:9780135163078Author:Michael SullivanPublisher:PEARSON
 Introduction to Linear Algebra, Fifth EditionAlgebraISBN:9780980232776Author:Gilbert StrangPublisher:Wellesley-Cambridge Press
 College Algebra (Collegiate Math)AlgebraISBN:9780077836344Author:Julie Miller, Donna GerkenPublisher:McGraw-Hill Education