
Videos
Baseball Pitcher Performance. Major League Baseball (MLB) consists of teams that play in the American League and the National League. MLB collects a wide variety of team and player statistics. Some of the statistics often used to evaluate pitching performance are as follows:
ERA: The average number of earned runs given up by the pitcher per nine innings. An earned run is any run that the opponent scores off a particular pitcher except for runs scored as a result of errors.
SO/IP: The average number of strikeouts per inning pitched.
HR/IP: The average number of home runs per inning pitched.
R/IP: The number of runs given up per inning pitched.
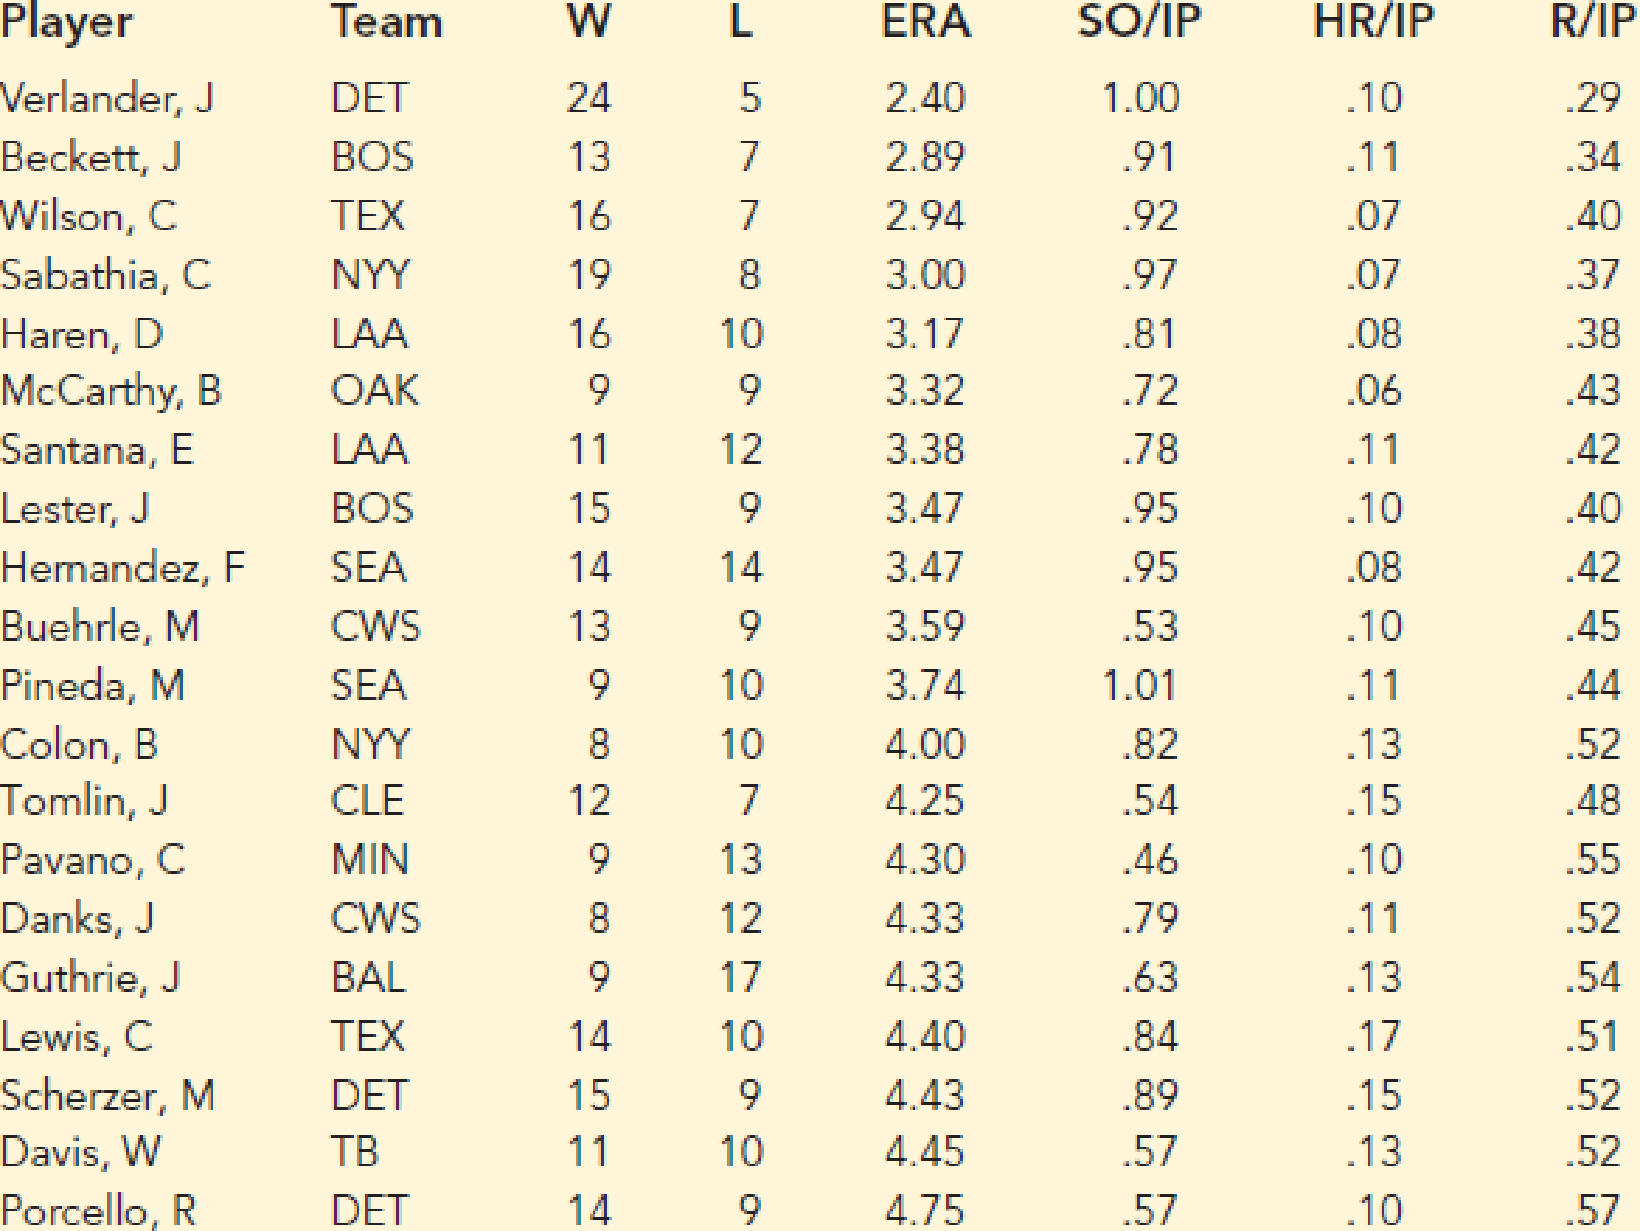
The following data show values for these statistics for a random sample of 20 pitchers from the American League for a full season.
- a. Develop an estimated regression equation that can be used to predict the average number of runs given up per inning given the average number of strikeouts per inning pitched.
- b. Develop an estimated regression equation that can be used to predict the average number of runs given up per inning given the average number of home runs per inning pitched.
- c. Develop an estimated regression equation that can be used to predict the average number of runs given up per inning given the average number of strikeouts per inning pitched and the average number of home runs per inning pitched.
- d. A. J. Burnett, a pitcher for the New York Yankees, had an average number of strikeouts per inning pitched of .91 and an average number of home runs per inning of .16. Use the estimated regression equation developed in part (c) to predict the average number of runs given up per inning for A. J. Burnett. (Note: The actual value for R/IP was .6.)
- e. Suppose a suggestion was made to also use the earned run average as another independent variable in part (c). What do you think of this suggestion?
a.
Find the estimated regression equation that could be used to predict the average number of runs given up per inning, when the average number of strikeouts per innings pitched is given.
Answer to Problem 10E
The estimated regression equation that could be used to predict the average number of runs given up per inning, when the average number of strikeouts per innings pitched is given is
Explanation of Solution
Calculation:
The Major League Baseball (MLB) dataset consist of statistics regarding the average number of earned runs given up by the pitcher per nine innings (ERA), the average number of strikeouts per innings pitched (SO/IP), the average number of home runs per innings pitched (HR/IP) and the number of runs given up per innings pitched (R/IP).
Multiple linear regression model:
A multiple linear regression model is given as
Regression:
Software procedure:
Step-by-step procedure to get the regression equation using EXCEL software:
- Open an EXCEL sheet and enter the data on W, L, ERA, SO/IP, HR/IP and R/IP corresponding to columns A, B, C, D, E and F, respectively.
- Select Data > Data Analysis > Regression.
- Click OK.
- Under Input Y Range enter $F$1:$F$21.
- Under Input X Range enter $D$1:$D$21.
- Click the box of Labels.
- Under Output Range enter $I$1.
- Click OK.
The output using EXCEL software is given as follows:
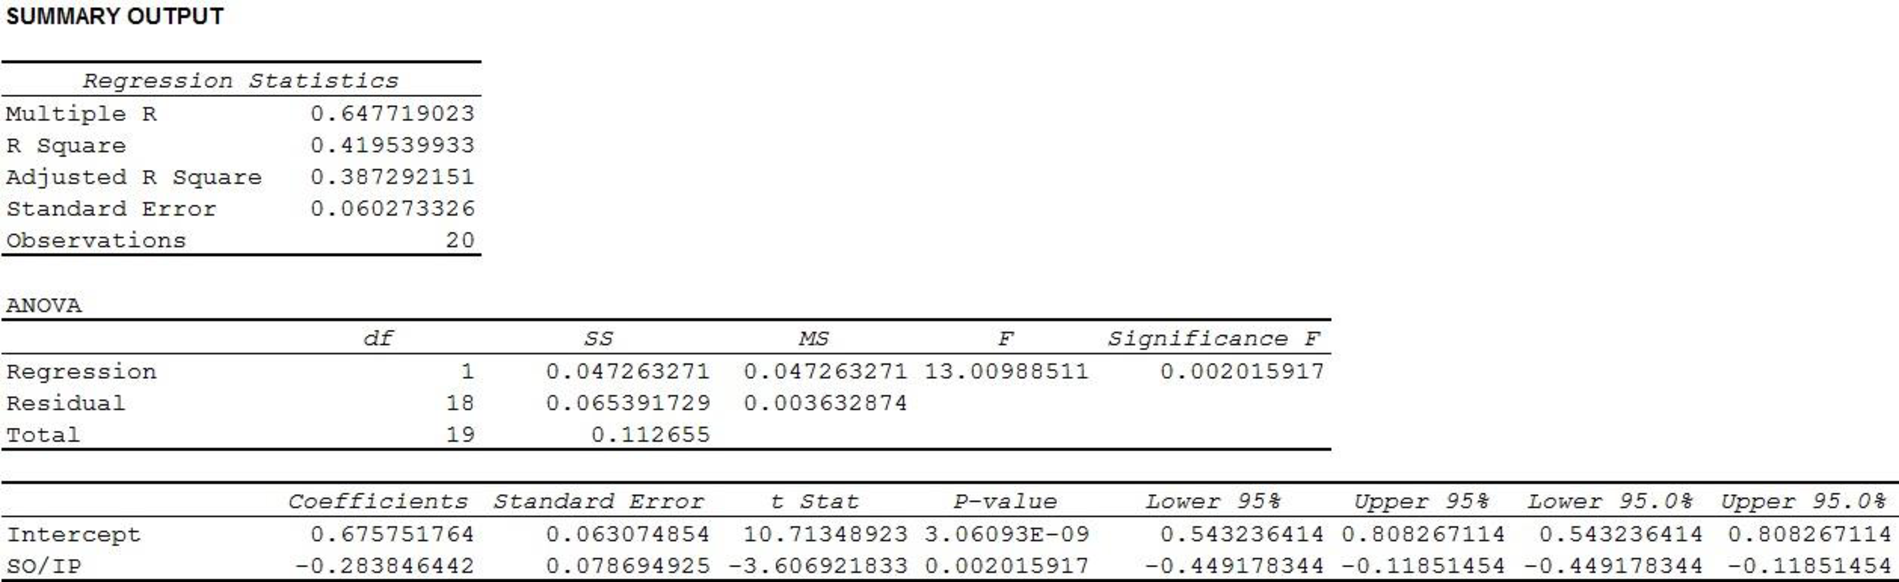
Thus, the estimated regression equation that could be used to predict the average number of runs given up per inning, when the average number of strikeouts per innings pitched is given is
b.
Find the estimated regression equation that could be used to predict the average number of runs given the average number of home runs per innings pitched.
Answer to Problem 10E
The estimated regression equation that could be used to predict the average number of runs given the average number of home runs per innings pitched is
Explanation of Solution
Calculation:
The regression equation can be obtained using EXCEL software.
Software procedure:
Step-by-step procedure to get regression equation using EXCEL software:
- Open an EXCEL sheet and enter the data of W, L, ERA, SO/IP, HR/IP and R/IP corresponding to columns A, B, C, D, E and F, respectively.
- Select Data > Data Analysis > Regression.
- Click OK.
- Under Input Y Range enter $F$1:$F$21.
- Under Input X Range enter $E$1:$E$21.
- Click the box of Labels.
- Under Output Range enter $L$1.
- Click OK.
The output using EXCEL software is given as,
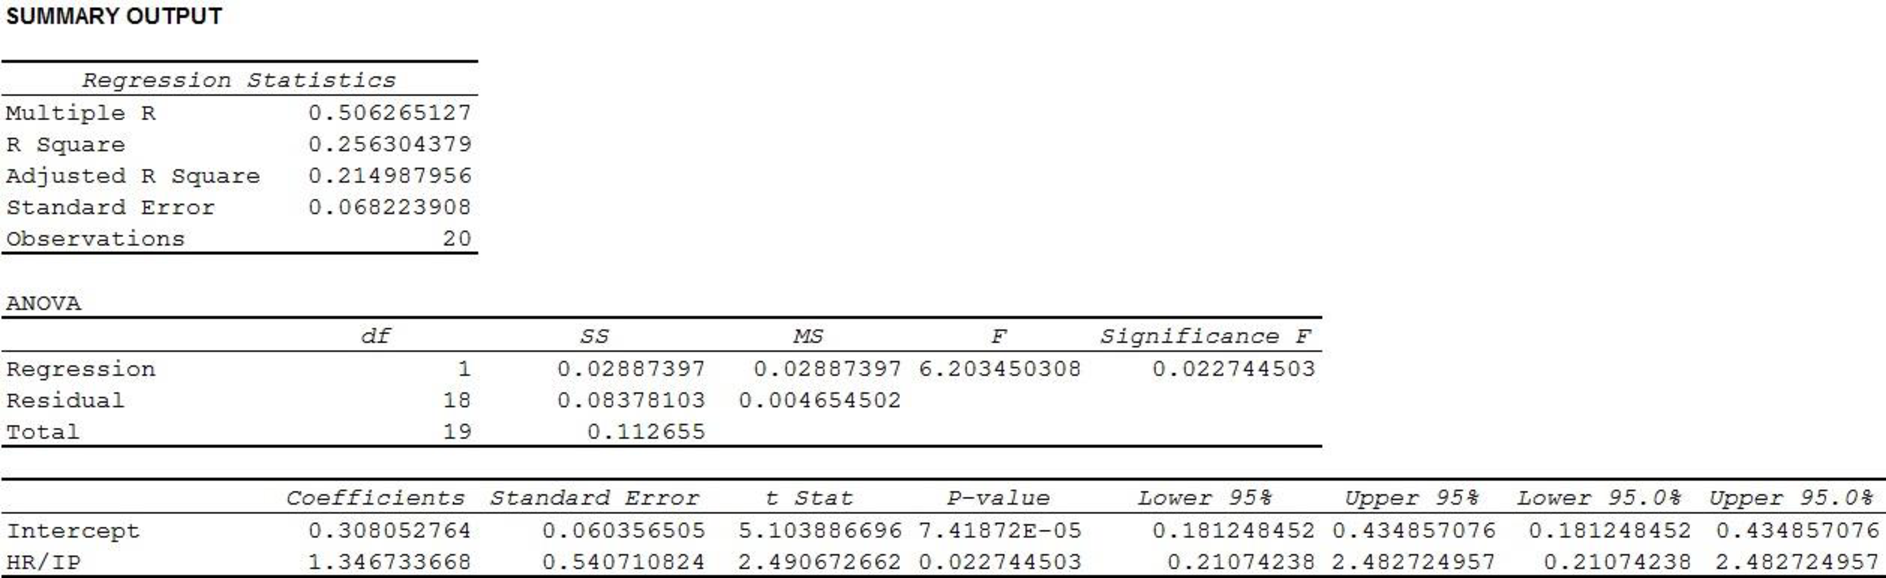
Thus, the estimated regression equation that could be used to predict the average number of runs given the average number of home runs per innings pitched is
c.
Find the estimated regression equation that could be used to predict the average number of runs given the average number of strikeouts per innings pitched and the average number of home runs per innings pitched.
Answer to Problem 10E
The estimated regression equation that could be used to predict the average number of runs given the average number of strikeouts per innings pitched and the average number of home runs per innings pitched is
Explanation of Solution
Calculation:
The regression equation can be obtained using EXCEL software.
Software procedure:
Step-by-step procedure to get regression equation using EXCEL software:
- Open an EXCEL sheet and enter the data of W, L, ERA, SO/IP, HR/IP and R/IP corresponding to columns A, B, C, D, E and F, respectively.
- Select Data > Data Analysis > Regression.
- Click OK.
- Under Input Y Range enter $F$1:$F$21.
- Under Input X Range enter $D$1:$E$21.
- Click the box of Labels.
- Under Output Range enter $O$1.
- Click OK.
The output using EXCEL software is given as,
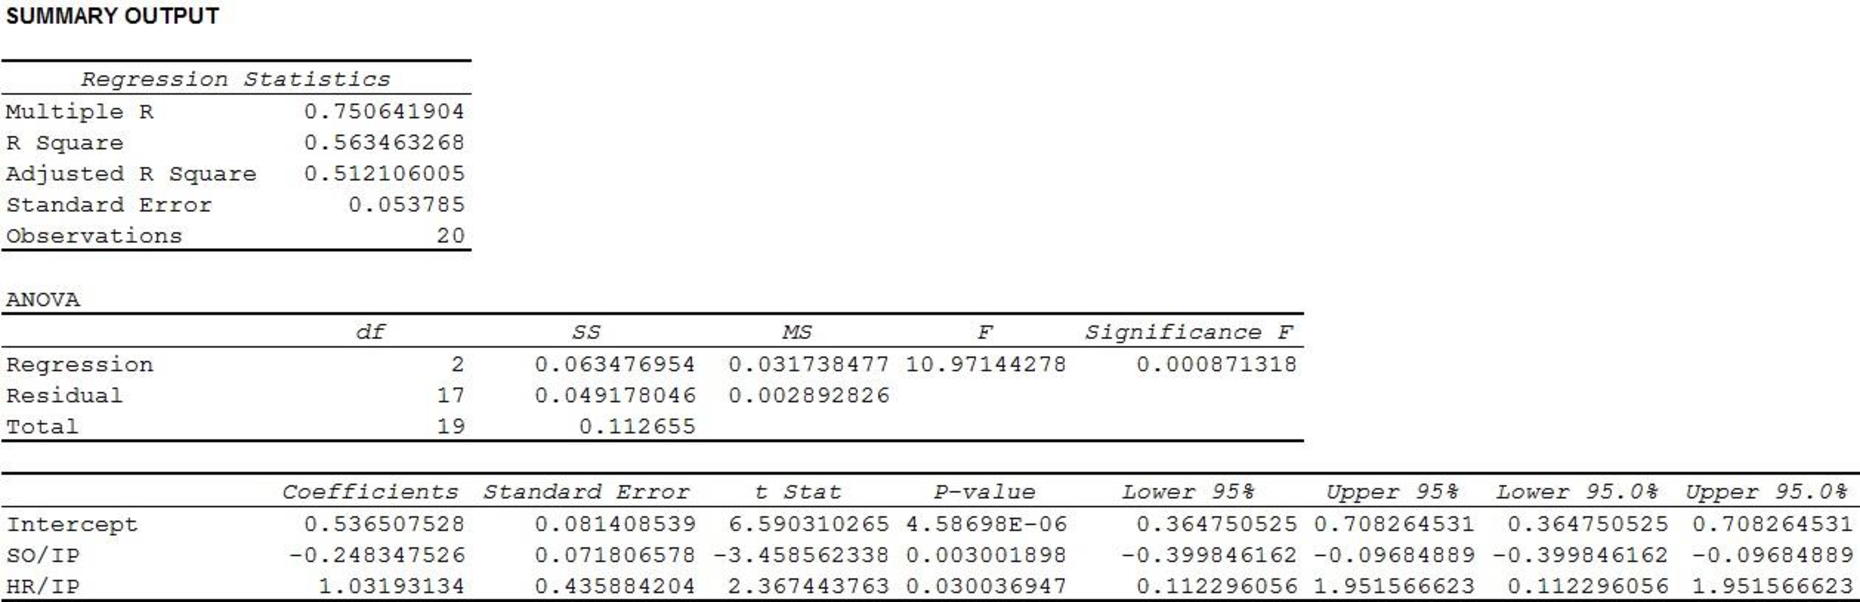
Thus, the estimated regression equation that could be used to predict the average number of runs given the average number of strikeouts per innings pitched and the average number of home runs per innings pitched is
d.
Predict the average number of runs given up per inning for Pitcher A using the regression equation of Part c.
Answer to Problem 10E
The predicted average number of runs given up per inning for Pitcher A is 0.4757.
Explanation of Solution
Calculation:
The average number of strikeouts and the average number of home runs per innings pitched for Pitcher A are 0.91 and 0.16, respectively.
From Part (c), it is found that estimated regression equation that could be used to predict the average number of runs given the average number of strikeouts per innings pitched and the average number of home runs per innings pitched is
Thus, using the given information, the predicted average number of runs given up per inning for Pitcher At is calculated below.
Thus, the predicted average number of runs given up per inning for Pitcher A is 0.4757.
It is to be noted that the actual average number of runs given up per inning for Pitcher A was 0.6.
Thus, the predicted value is slightly less than the actual value. Hence, the residual is positive, which underestimates the model slightly.
e.
Explain about the suggestion to use the earned run average as another independent variable in the regression model developed in Part c.
Explanation of Solution
Calculation:
It would be useful to use the earned run average or ERA as a third independent variable, only if it has a strong linear association with the response variable, R/IP. The correlation coefficient measures the strength of the linear relation between two variables.
Software procedure:
Step-by-step procedure to get correlation coefficient using EXCEL software:
- Open an EXCEL sheet and enter the data of W, L, ERA, SO/IP, HR/IP and R/IP corresponding to columns A, B, C, D, E and F, respectively.
- In cell I1 enter the formula =CORREL(F1:F21,C1:C21).
- Press Enter.
The EXCEL output is given as follows:
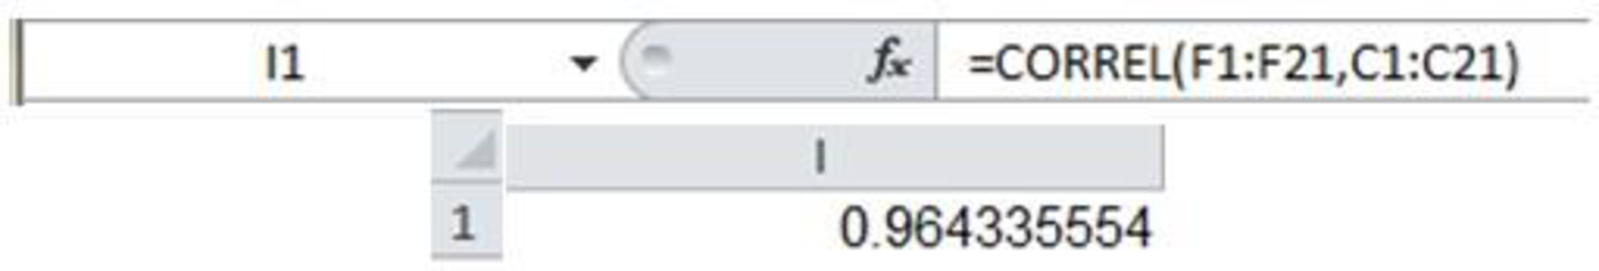
Thus, the correlation coefficient between R/IO and ERA is approximately 0.964, which is very close to 1, indicating a very strong positive linear relationship between the variables.
Due to the high correlation coefficient it can be said that if a pitcher gives up more runs per inning, then the pitcher’s run average also increases. Thus, automatically there will be high value of the coefficient of determination in the regression analysis, if ERA is used as a predictor variable.
Thus, it is reasonable to use the earned run average as another independent variable in the regression model developed in Part c.
Want to see more full solutions like this?
Chapter 15 Solutions
Essentials of Statistics for Business and Economics (with XLSTAT Printed Access Card)


- Question 6: Negate the following compound statements, using De Morgan's laws. A) If Alberta was under water entirely then there should be no fossil of mammals.arrow_forwardNegate the following compound statement using De Morgans's laws.arrow_forwardCharacterize (with proof) all connected graphs that contain no even cycles in terms oftheir blocks.arrow_forward
- Let G be a connected graph that does not have P4 or C3 as an induced subgraph (i.e.,G is P4, C3 free). Prove that G is a complete bipartite grapharrow_forwardProve sufficiency of the condition for a graph to be bipartite that is, prove that if G hasno odd cycles then G is bipartite as follows:Assume that the statement is false and that G is an edge minimal counterexample. That is, Gsatisfies the conditions and is not bipartite but G − e is bipartite for any edge e. (Note thatthis is essentially induction, just using different terminology.) What does minimality say aboutconnectivity of G? Can G − e be disconnected? Explain why if there is an edge between twovertices in the same part of a bipartition of G − e then there is an odd cyclearrow_forwardLet G be a connected graph that does not have P4 or C4 as an induced subgraph (i.e.,G is P4, C4 free). Prove that G has a vertex adjacent to all othersarrow_forward
- We consider a one-period market with the following properties: the current stock priceis S0 = 4. At time T = 1 year, the stock has either moved up to S1 = 8 (with probability0.7) or down towards S1 = 2 (with probability 0.3). We consider a call option on thisstock with maturity T = 1 and strike price K = 5. The interest rate on the money marketis 25% yearly.(a) Find the replicating portfolio (φ, ψ) corresponding to this call option.(b) Find the risk-neutral (no-arbitrage) price of this call option.(c) We now consider a put option with maturity T = 1 and strike price K = 3 onthe same market. Find the risk-neutral price of this put option. Reminder: A putoption gives you the right to sell the stock for the strike price K.1(d) An investor with initial capital X0 = 0 wants to invest on this market. He buysα shares of the stock (or sells them if α is negative) and buys β call options (orsells them is β is negative). He invests the cash balance on the money market (orborrows if the amount is…arrow_forwardDetermine if the two statements are equivalent using a truth tablearrow_forwardQuestion 4: Determine if pair of statements A and B are equivalent or not, using truth table. A. (~qp)^~q в. р л~9arrow_forward
- Determine if the two statements are equalivalent using a truth tablearrow_forwardQuestion 3: p and q represent the following simple statements. p: Calgary is the capital of Alberta. A) Determine the value of each simple statement p and q. B) Then, without truth table, determine the va q: Alberta is a province of Canada. for each following compound statement below. pvq р^~q ~рл~q ~q→ p ~P~q Pq b~ (d~ ← b~) d~ (b~ v d) 0 4arrow_forward2. Let X be a random variable. (a) Show that, if E X2 = 1 and E X4arrow_forwardarrow_back_iosSEE MORE QUESTIONSarrow_forward_ios
 Holt Mcdougal Larson Pre-algebra: Student Edition...AlgebraISBN:9780547587776Author:HOLT MCDOUGALPublisher:HOLT MCDOUGAL
 Glencoe Algebra 1, Student Edition, 9780079039897...AlgebraISBN:9780079039897Author:CarterPublisher:McGraw Hill
 Big Ideas Math A Bridge To Success Algebra 1: Stu...AlgebraISBN:9781680331141Author:HOUGHTON MIFFLIN HARCOURTPublisher:Houghton Mifflin Harcourt
 Algebra & Trigonometry with Analytic GeometryAlgebraISBN:9781133382119Author:SwokowskiPublisher:Cengage
 Algebra: Structure And Method, Book 1AlgebraISBN:9780395977224Author:Richard G. Brown, Mary P. Dolciani, Robert H. Sorgenfrey, William L. ColePublisher:McDougal Littell