
Concept explainers
Videos
A portion of a data set containing information for 45 mutual funds that are part of the Morningstar Funds 500 follows. The complete data set is available in the file named MutualFunds. The data set includes the following five variables:
Fund Type: The type of fund, labeled DE (Domestic Equity), IE (International Equity), and FI (Fixed Income).
Net Asset Value ($): The closing price per share on December 31, 2007.
5-Year Average Return (%): The average annual return for the fund over the past five years. Expense Ratio (%): The percentage of assets deducted each fiscal year for fund expenses. Morningstar Rank: The risk adjusted star rating for each fund; Morningstar ranks go from a low of 1-Star to a high of 5-Stars.
| Fund Name | Fund Type | Net Asset Value ($) | 5-Year Average Return (%) | Expense Ratio (%) | Morningstar Rank |
| Amer Cent Inc & Growth Inv | DE | 28.88 | 12.39 | .67 | 2-Star |
| American Century Intl. Disc | IE | 14.37 | 30.53 | 1.41 | 3-Star |
| American Century Tax-Free Bond | FI | 10.73 | 3.34 | .49 | 4-Star |
| American Century Ultra | DE | 24.94 | 10.88 | .99 | 3-Star |
| Ariel | DE | 46.39 | 11.32 | 1.03 | 2-Star |
| Artisan Intl Val | IE | 25.52 | 24.95 | 1.23 | 3-Star |
| Artisan Small Cap | DE | 16.92 | 15.67 | 1.18 | 3-Star |
| Baron Asset | DE | 50.67 | 16.77 | 1.31 | 5-Star |
| Brandywine | DE | 36.58 | 18.14 | 1.08 | 4-Star |
| . | . | . | . | . | . |
| . | . | . | . | . | . |
| . | . | . | . | . | . |
- a. Develop an estimated regression equation that can be used to predict the 5-year average return given the type of fund. At the .05 level of significance, test for a significant relationship.
- b. Did the estimated regression equation developed in part (a) provide a good fit to the data? Explain.
- c. Develop the estimated regression equation that can be used to predict the 5-year average return given the type of fund, the net asset value, and the expense ratio. At the .05 level of significance, test for a significant relationship. Do you think any variables should be deleted from the estimated regression equation? Explain.
- d. Morningstar Rank is a categorical variable. Because the data set contains only funds with four ranks (2-Star through 5-Star), use the following dummy variables: 3Star-Rank = 1 for a 3-Star fund, 0 otherwise; 4StarRank = 1 for a 4-Star fund, 0 otherwise; and 5StarRank = 1 for a 5-Star fund, 0 otherwise. Develop an estimated regression equation that can be used to predict the 5-year average return given the type of fund, the expense ratio, and the Morningstar Rank. Using a = .05, remove any independent variables that are not significant.
- e. Use the estimated regression equation developed in part (d) to predict the 5-year average return for a domestic equity fund with an expense ratio of 1.05% and a 3-Star Morningstar Rank.
a.
Find an estimated regression equation that could be used to predict the 5-year average return given the type of fund.
Perform a test to check the significant relationship between variables at
Answer to Problem 56SE
The estimated regression equation that could be used to predict the 5-year average return given the type of fund is
There is a significant relationship between dependent variable (y) and independent variables FundDE (
Explanation of Solution
Calculation:
The data related to the type of fund, net asset value, 5 year average return, expense ratio and management risk of 45 mutual funds.
Multiple linear regression model:
A multiple linear regression model is given as
The dummy variable FundDE is defined as is,
The dummy variable FundIE is defined as is,
Indicator variable:
Software procedure:
Step by step procedure to create indicator variable using MINITAB software is given as,
- Choose Calc>Make Indicator variables.
- InMake indicator variables for, enterFund Type.
- In Distinct Value, enter 1 for DE and0 for IE, FI.
- Click OK.
The indicator variable is stored in the column of ‘FundDE’.
Software procedure:
Step by step procedure to create indicator variable using MINITAB software is given as,
- Choose Calc>Make Indicator variables.
- InMake indicator variables for, enterDrive.
- In Distinct Value, enter 1 for IE and0 for DE, FI.
- Click OK.
The indicator variable is stored in the column of ‘FundIE’.
In the given problem, five year average return be the dependent variable (y), FundDE be the independent variable (
Regression:
Software procedure:
Step by step procedure to obtain regression equation using MINITAB software is given as,
- Choose Stat > Regression > Regression > Fit Regression Model.
- Under Responses, enter the column of y.
- Under Continuous predictors, enter the columns ofFundDE, FundIE.
- Click OK.
Output using MINITAB software is given below:
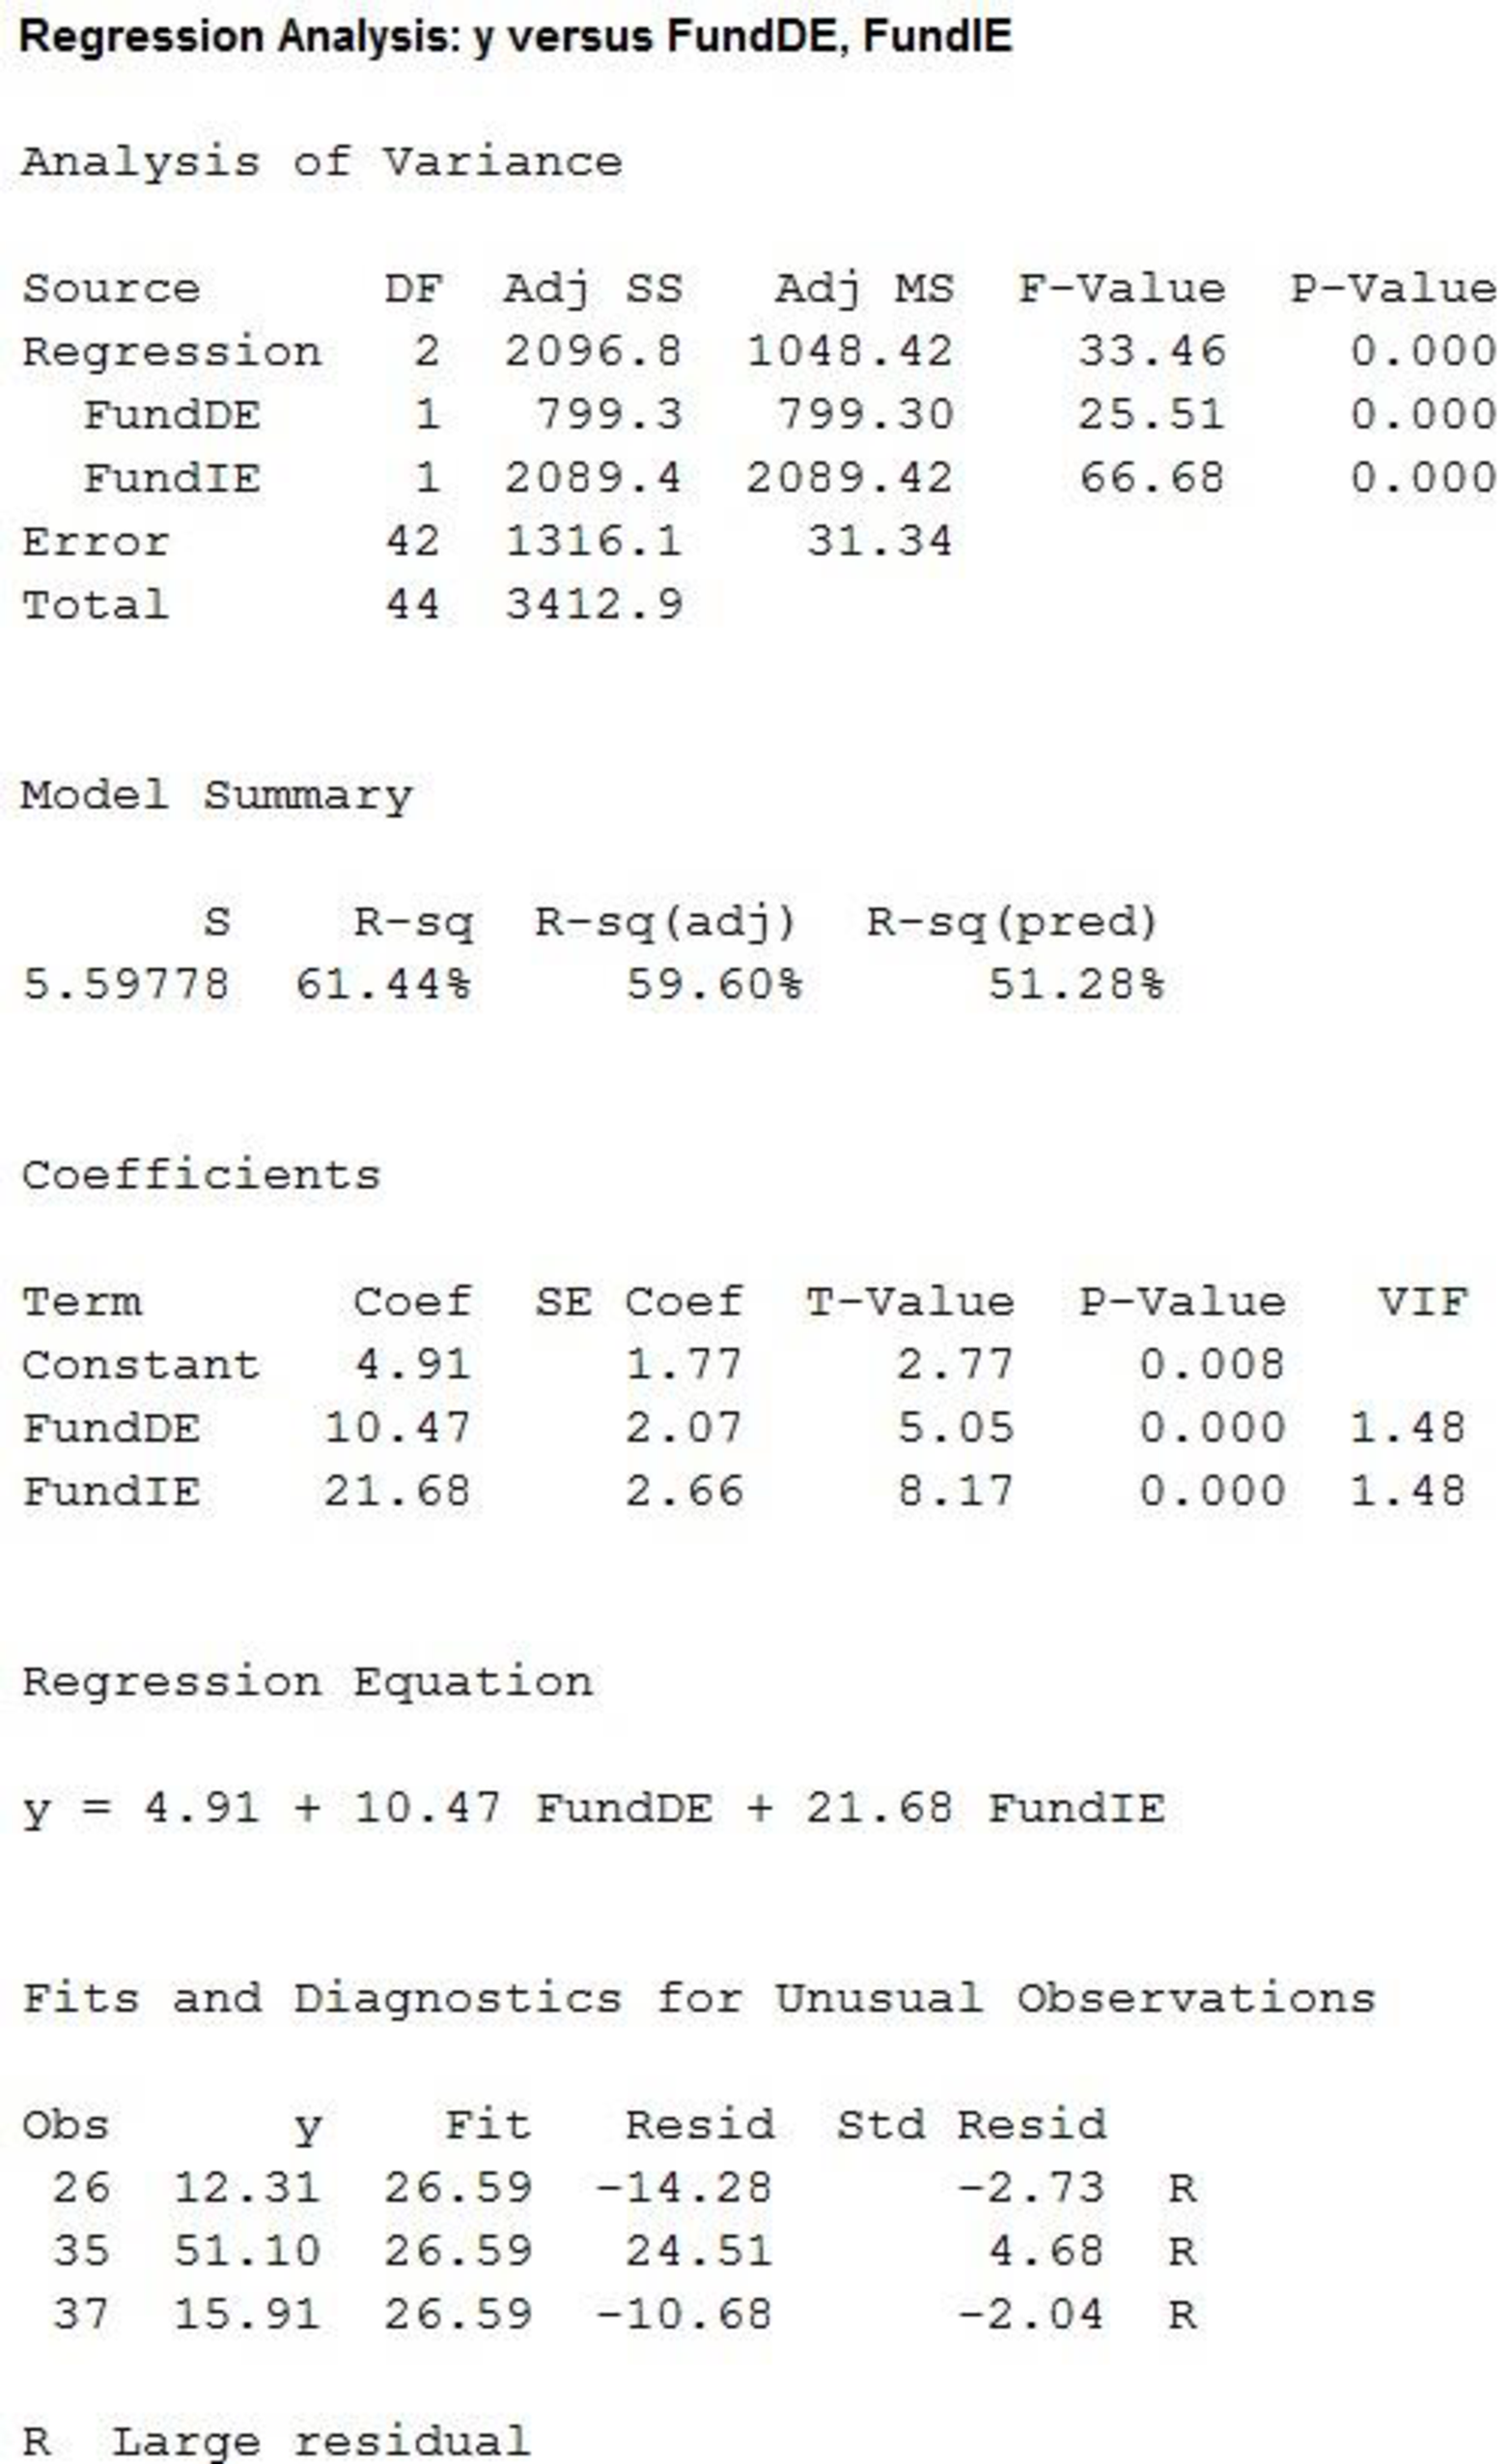
Thus, the estimated regression equation that could be used to predict the 5-year average return given the type of fund is
State the test hypotheses.
Null hypothesis:
That is, there is not a significant relationship between dependent variable (y) and independent variables FundDE (
Alternative hypothesis:
That is, there is a significant relationship between dependent variable (y) and independent variables FundDE (
According the output, it is found that the F statistic with numerator df of 1 and denominator df of 42, corresponding to regression is 33.4584 and the p value for F statistic corresponding to regression is 0.000.
Level of significance:
The given level of significance is
Rejection rule:
If the
Conclusion:
Here, the p-value is less than the level of significance.
That is,
Thus, the decision is “reject the null hypothesis”.
Therefore, the data provide sufficient evidence to conclude that there is a significant relationship between dependent variable (y) and independent variables FundDE (
b.
Whether the estimated regression equation in part (a) provides a good fit.
Explanation of Solution
The coefficient of determination (
In the given output,
Thus, the percentage of variation in the observed values of dependent variable that is explained by the regression is 61.44%, which indicates that 61.44% of the variability in dependent variable is explained by the variability in independent variables using the linear regression model.
Thus, the model provides a good fit.
c.
Find an estimated regression equation that could be used to predict the 5-year average return given the type of fund, the net asset value and the expense ratio.
Perform a test to check the significant relationship between variables at
Explain whether any variable should be deleted from the estimated regression equation.
Answer to Problem 56SE
The estimated regression equation that could be used to predict the 5-year average return given the type of fund, the net asset value and the expense ratio is
There is a significant relationship between dependent variable (y) and independent variables FundDE (
The Net Asset value should be deleted from the estimated regression equation.
Explanation of Solution
Calculation:
Here, five year average return be the dependent variable (y), FundDE (
Regression:
Software procedure:
Step by step procedure to obtain regression equation using MINITAB software is given as,
- Choose Stat > Regression > Regression > Fit Regression Model.
- Under Responses, enter the column of y.
- Under Continuous predictors, enter the columns ofFundDE, FundIE, Net Asset Value, and Expense Ratio.
- Click OK.
Output using MINITAB software is given below:
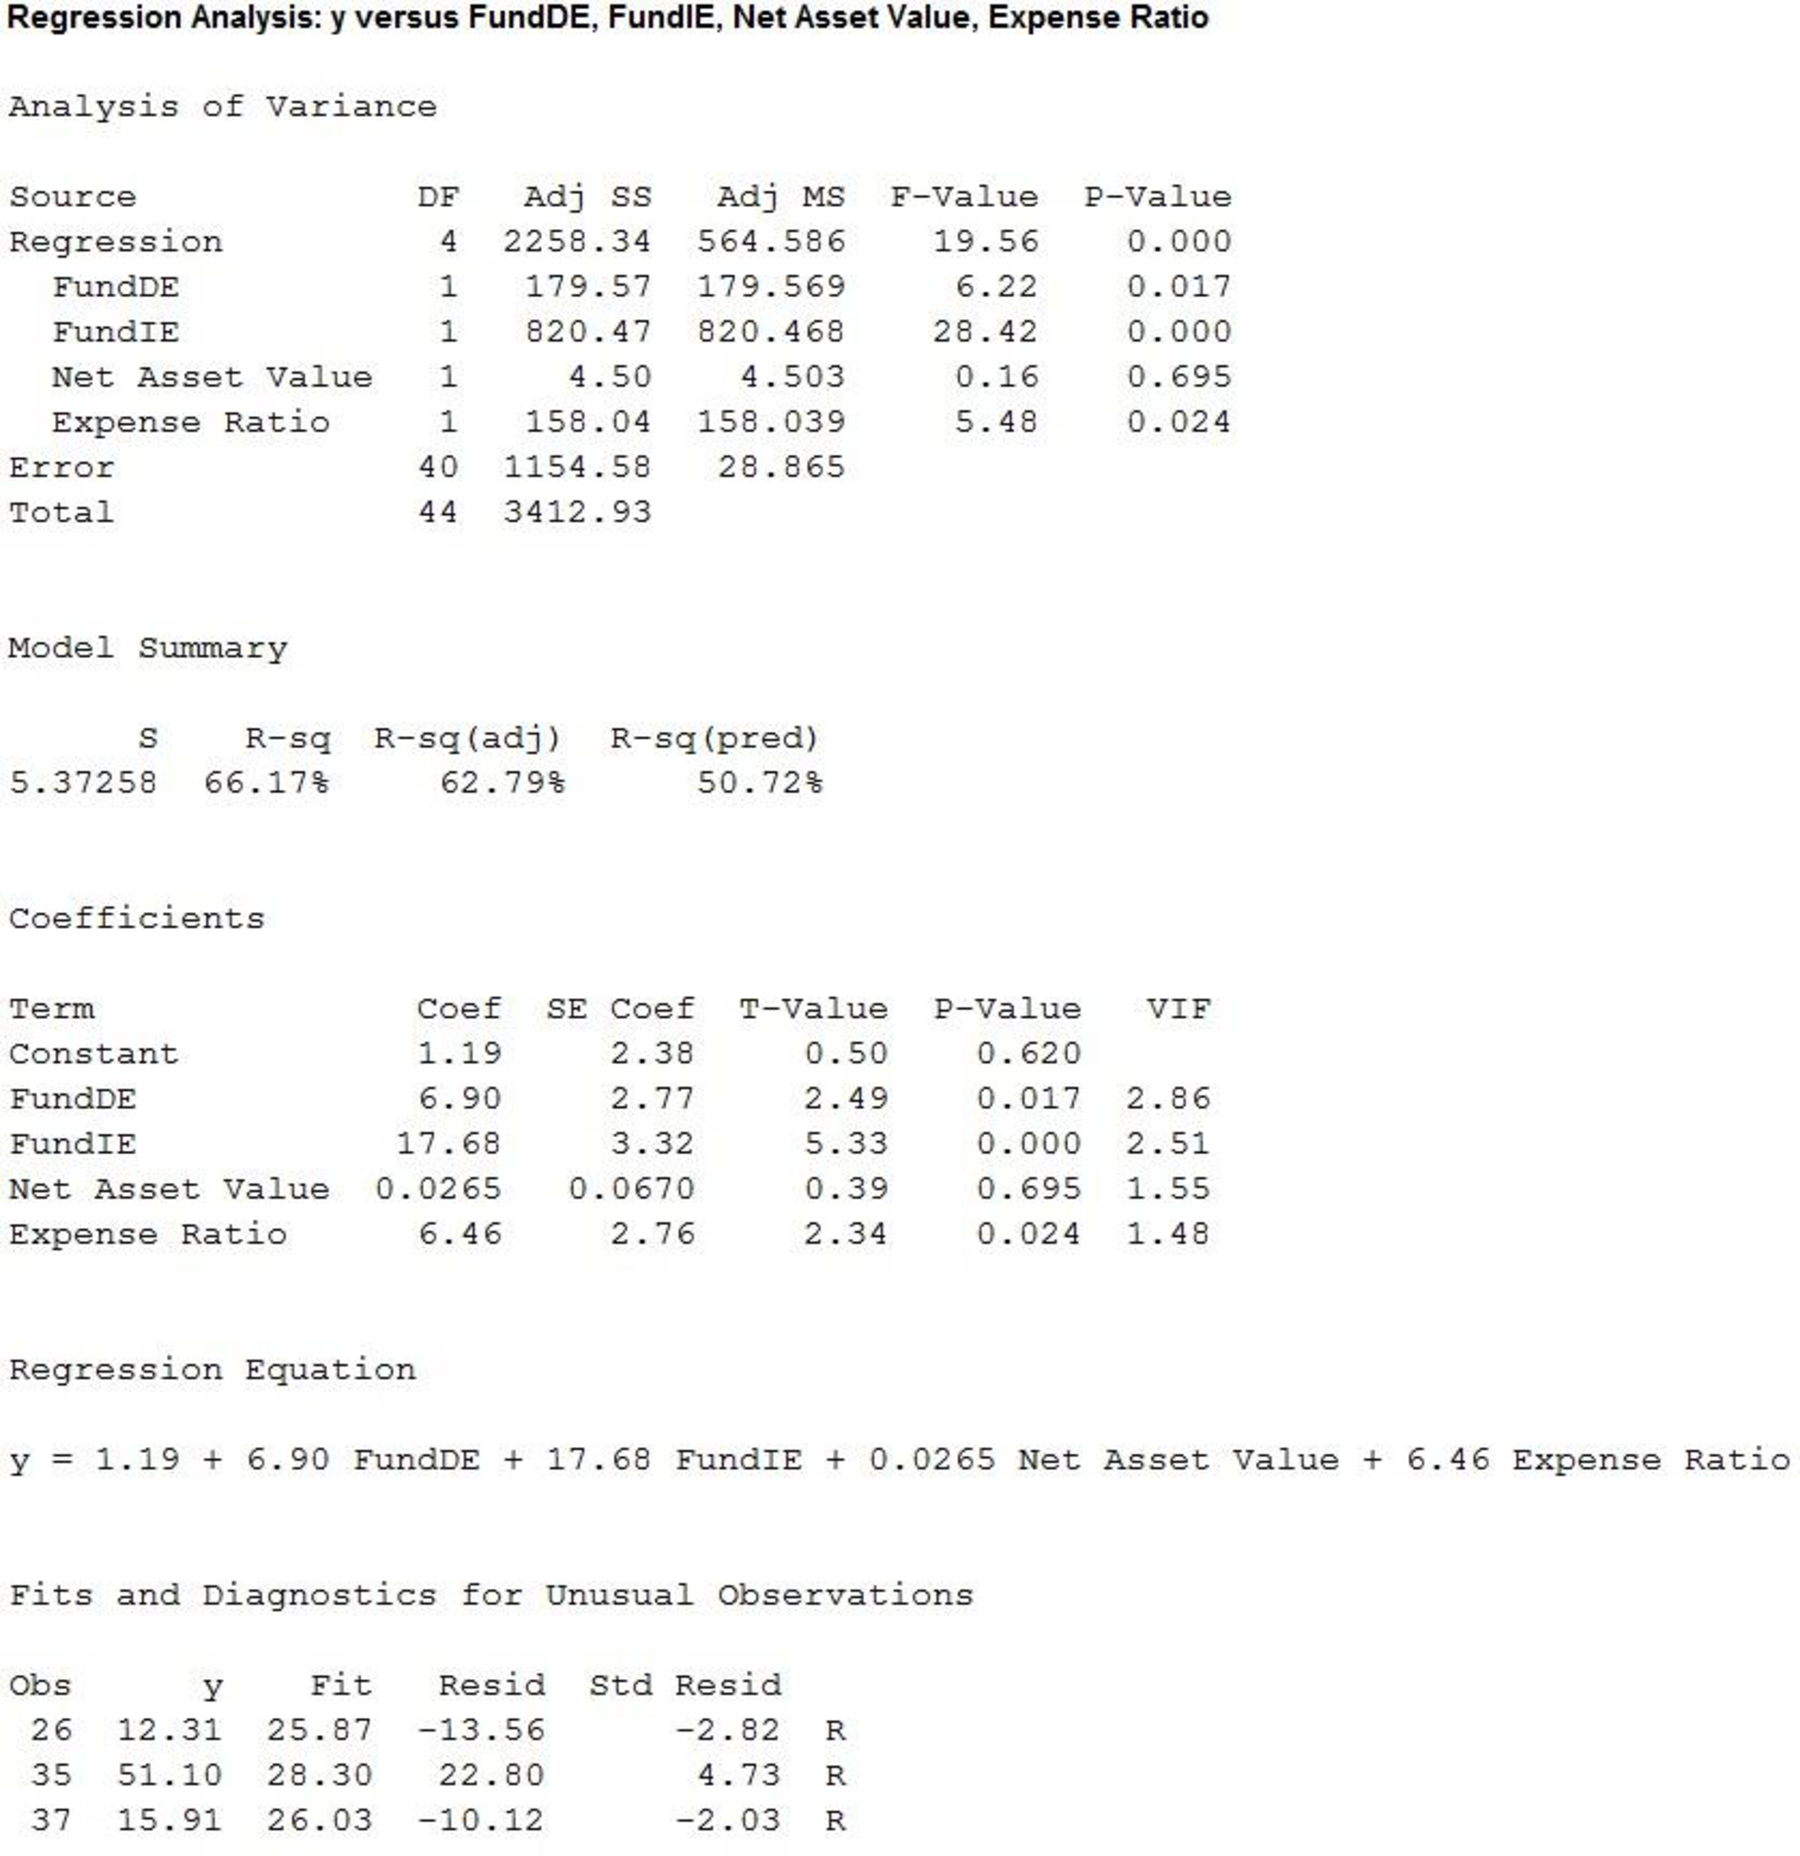
Thus,the estimated regression equation that could be used to predict the 5-year average return given the type of fund, the net asset value and the expense ratio is
State the test hypotheses.
Null hypothesis:
That is, there is not a significant relationship between dependent variable (y) and independent variables FundDE (
Alternative hypothesis:
That is, there is a significant relationship between dependent variable (y) and independent variables FundDE (
According the output, it is found that the F statistic with numerator df of 1 and denominator df of 40, corresponding to regression is 19.5598 and the p value for F statistic corresponding to regression is 0.000.
Level of significance:
The given level of significance is
Rejection rule:
If the
Conclusion:
Here, the p-value is less than the level of significance.
That is,
Thus, the decision is “reject the null hypothesis”.
Therefore, the data provide sufficient evidence to conclude that there is a significant relationship between dependent variable (y) and independent variables FundDE (
State the test hypotheses.
Null hypothesis:
That is, the addition of the independent variable FundDE is not significant.
Alternative hypothesis:
That is, the addition of the independent variable FundDE is significant.
From the output, it is found that the t statistic corresponding to FundDE is 2.7651 with df of 40 and the p value is 0.017.
Level of significance:
Assume the level of significance is
Rejection rule:
If the
Conclusion:
Here, the p-value is less than the level of significance.
That is,
Thus, the decision is “reject the null hypothesis”.
Therefore, the data provide sufficient evidence to conclude that the addition of the independent variable FundDE is significant.
State the test hypotheses.
Null hypothesis:
That is, the addition of the FundIE is not significant.
Alternative hypothesis:
That is, the addition of the FundIE is significant.
From the output, it is found that the t statistic corresponding to FundIE is 5.3315 with df of 40 and the p value is 0.000.
Level of significance:
Assume the level of significance is
Rejection rule:
If the
Conclusion:
Here, the p-value is less than the level of significance.
That is,
Thus, the decision is “reject the null hypothesis”.
Therefore, the data provide sufficient evidence to conclude that the addition of the dummy variableFundIE is significant.
State the test hypotheses.
Null hypothesis:
That is, the addition of the Net Asset Value is not significant.
Alternative hypothesis:
That is, the addition of the Net Asset Value is significant.
From the output, it is found that the t statistic corresponding to Net Asset Value is 0.6950 with df of 40 and the p value is 0.695.
Level of significance:
Assume the level of significance is
Rejection rule:
If the
Conclusion:
Here, the p-value is greater than the level of significance.
That is,
Thus, the decision is “fail to reject the null hypothesis”.
Therefore, the data provide sufficient evidence to conclude that the addition of the Net Asset Value is significant.
State the test hypotheses.
Null hypothesis:
That is, the addition of the Expense Ratio is not significant.
Alternative hypothesis:
That is, the addition of the Expense Ratio is significant.
From the output, it is found that the t statistic corresponding to Expense Ratio is 2.3399 with df of 40 and the p value is 0.024.
Level of significance:
Assume the level of significance is
Rejection rule:
If the
Conclusion:
Here, the p-value is less than the level of significance.
That is,
Thus, the decision is “reject the null hypothesis”.
Therefore, the data provide sufficient evidence to conclude that the addition of the Expense Ratio is significant.
Thus, Net Asset value is not significant and it should be deleted from the estimated regression equation.
d.
Find an estimated regression equation that could be used to predict the 5-year average return given the type of fund, the expense ratio and the Morningstar Rank.
Perform a test at
Answer to Problem 56SE
The estimated regression equation that could be used to predict the 5-year average return given the type of fund, the expense ratio and the Morningstar Rank is
None of the independent variables are deleted from the regression equation.
Explanation of Solution
Calculation:
The dummy variable 3StarRank is defined as is,
The dummy variable 4StarRank is defined as is,
The dummy variable 5StarRank is defined as is,
Indicator variable:
Software procedure:
Step by step procedure to create indicator variable using MINITAB software is given as,
- Choose Calc>Make Indicator variables.
- InMake indicator variables for, enterMorningstar Rank.
- In Distinct Value, enter 1 for 3-Star and0 for 2-Star, 4-Star, 5-Star.
- Click OK.
The indicator variable is stored in the column of ‘3StarRank’.
Software procedure:
Step by step procedure to create indicator variable using MINITAB software is given as,
- Choose Calc>Make Indicator variables.
- InMake indicator variables for, enterMorningstar Rank.
- In Distinct Value, enter 1 for 4-Star and0 for 2-Star, 3-Star, 5-Star.
- Click OK.
The indicator variable is stored in the column of ‘4StarRank’.
Software procedure:
Step by step procedure to create indicator variable using MINITAB software is given as,
- Choose Calc>Make Indicator variables.
- InMake indicator variables for, enterMorningstar Rank.
- In Distinct Value, enter 1 for 5-Star and0 for 2-Star, 3-Star, 4-Star.
- Click OK.
The indicator variable is stored in the column of ‘5StarRank’.
Here, five year average return be the dependent variable (y), FundDE (
Regression:
Software procedure:
Step by step procedure to obtain regression equation using MINITAB software is given as,
- Choose Stat > Regression > Regression > Fit Regression Model.
- Under Responses, enter the column of y.
- Under Continuous predictors, enter the columns ofFundDE, FundIE, Expense Ratio,3StarRank, 4StarRank and5StarRank.
- Click OK.
Output using MINITAB software is given below:
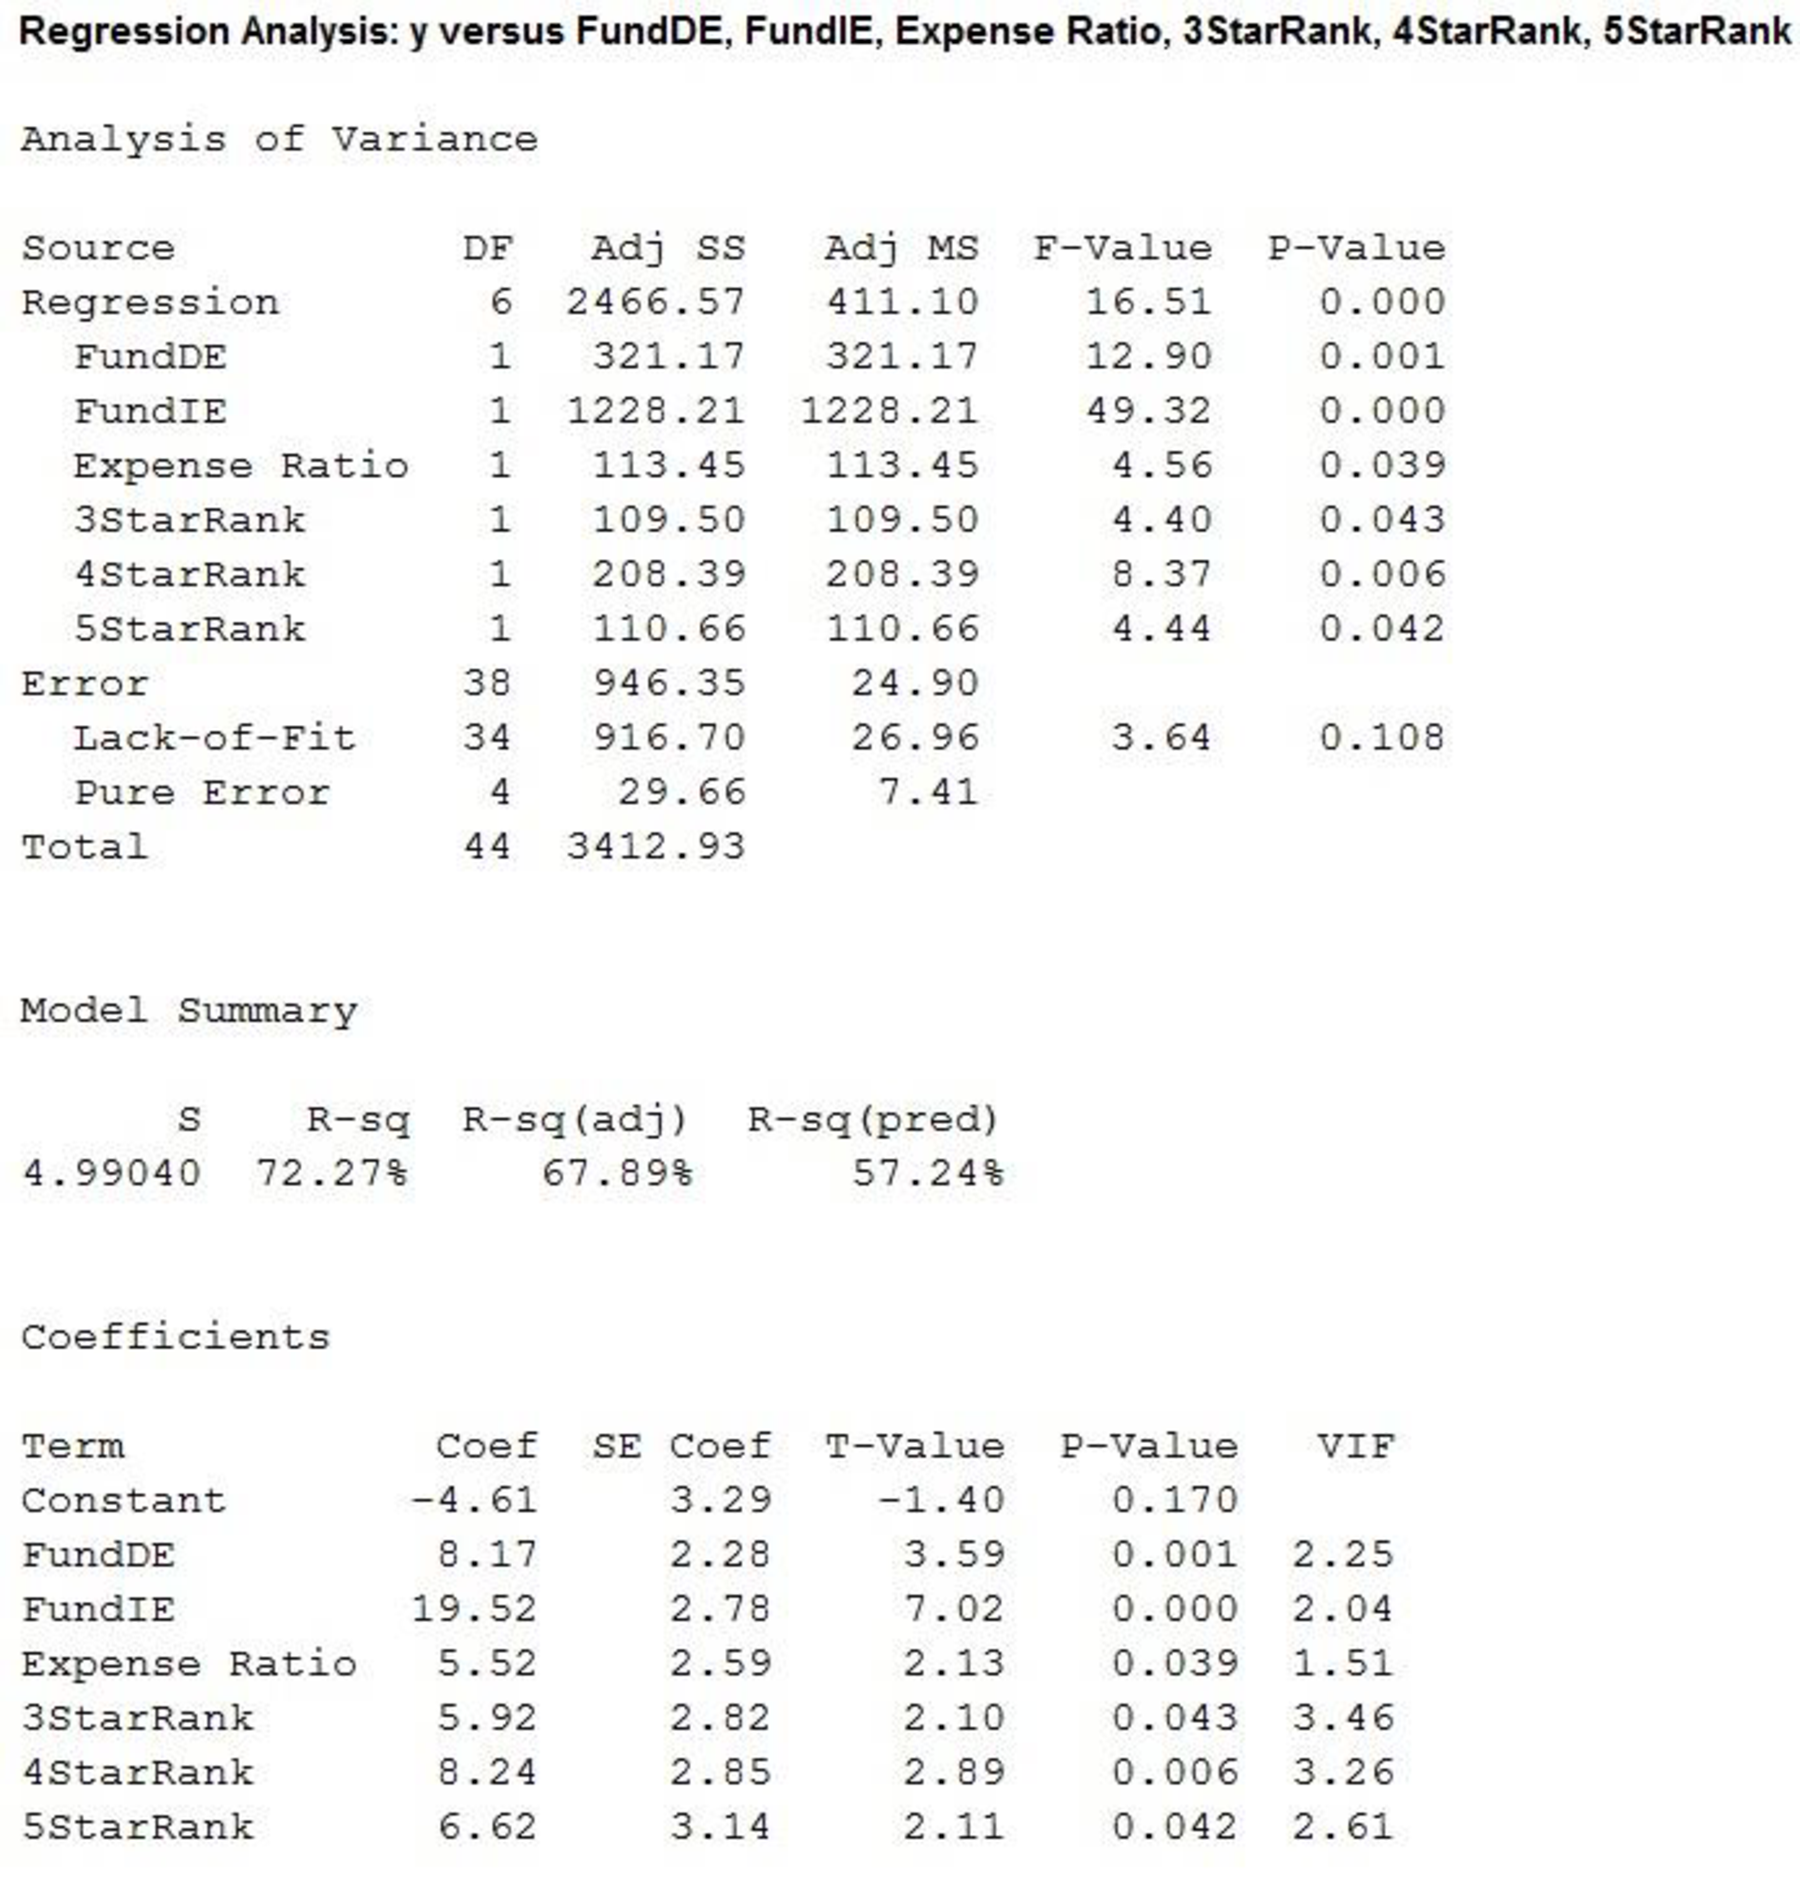
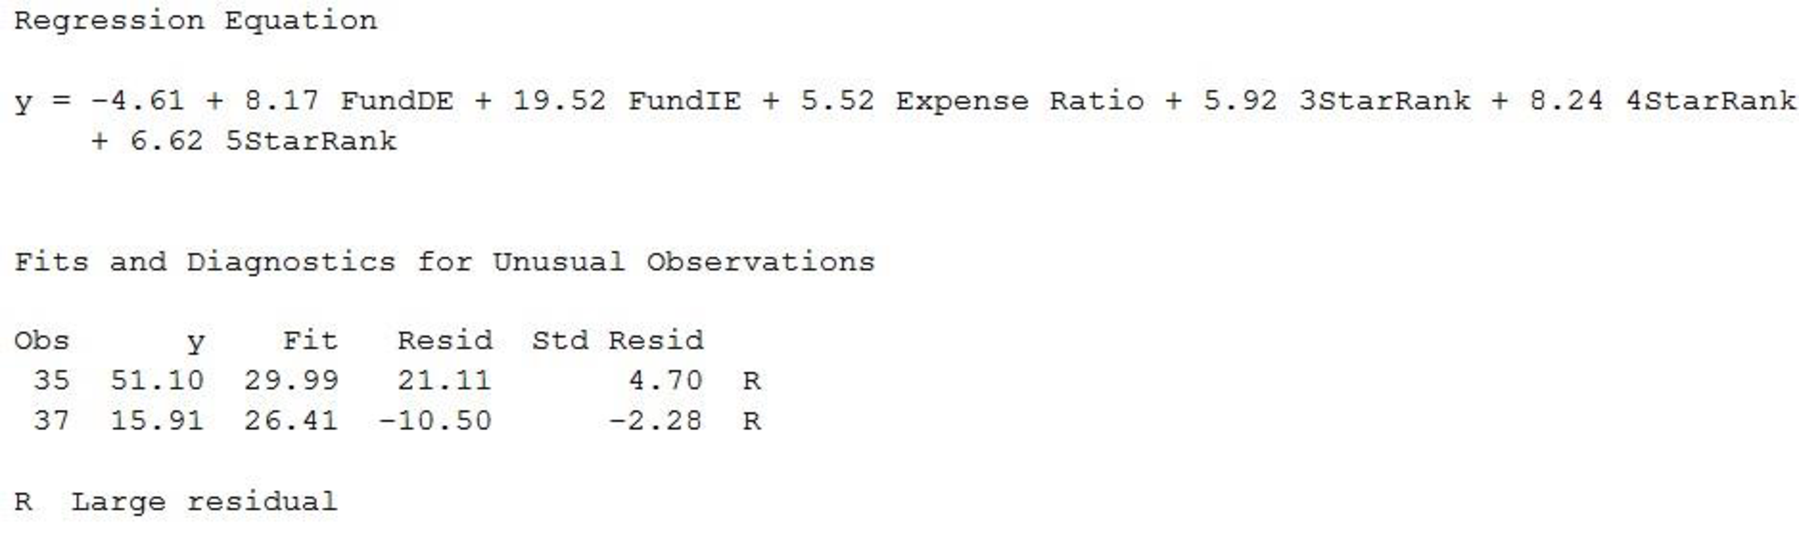
Thus, the estimated regression equation that could be used to predict the 5-year average return given the type of fund, the expense ratio and the Morningstar Rank is
State the test hypotheses.
Null hypothesis:
That is, the addition of the independent variable FundDE is not significant.
Alternative hypothesis:
That is, the addition of the independent variable FundDE is significant.
From the output, it is found that the t statistic corresponding to FundDE is 3.59 with df of 38 and the p value is 0.001.
Level of significance:
Assume the level of significance is
Rejection rule:
If the
Conclusion:
Here, the p-value is less than the level of significance.
That is,
Thus, the decision is “reject the null hypothesis”.
Therefore, the data provide sufficient evidence to conclude that the addition of the independentvariable FundDE is significant.
State the test hypotheses.
Null hypothesis:
That is, the addition of the FundIE is not significant.
Alternative hypothesis:
That is, the addition of the FundIE is significant.
From the output, it is found that the t statistic corresponding to FundIE is 7.02 with df of 38 and the p value is 0.000.
Level of significance:
Assume the level of significance is
Rejection rule:
If the
Conclusion:
Here, the p-value is less than the level of significance.
That is,
Thus, the decision is “reject the null hypothesis”.
Therefore, the data provide sufficient evidence to conclude that the addition of the dummy variableFundIE is significant.
State the test hypotheses.
Null hypothesis:
That is, the addition of the Expense Ratio is not significant.
Alternative hypothesis:
That is, the addition of the Expense Ratio is significant.
From the output, it is found that the t statistic corresponding to Expense Ratio is 2.13 with df of 38 and the p value is 0.039.
Level of significance:
Assume the level of significance is
Rejection rule:
If the
Conclusion:
Here, the p-value is less than the level of significance.
That is,
Thus, the decision is “reject the null hypothesis”.
Therefore, the data provide sufficient evidence to conclude that the addition of the Expense Ratio is significant.
State the test hypotheses.
Null hypothesis:
That is, the addition of the 3StarRank is not significant.
Alternative hypothesis:
That is, the addition of the 3StarRank is significant.
From the output, it is found that the t statistic corresponding to 3StarRank is 2.10 with df of 38 and the p value is 0.043.
Level of significance:
Assume the level of significance is
Rejection rule:
If the
Conclusion:
Here, the p-value is less than the level of significance.
That is,
Thus, the decision is “reject the null hypothesis”.
Therefore, the data provide sufficient evidence to conclude that the addition of the 3StarRank is significant.
State the test hypotheses.
Null hypothesis:
That is, the addition of the 4StarRank is not significant.
Alternative hypothesis:
That is, the addition of the 4StarRank is significant.
From the output, it is found that the t statistic corresponding to 4StarRank is 2.89 with df of 38 and the p value is 0.006.
Level of significance:
Assume the level of significance is
Rejection rule:
If the
Conclusion:
Here, the p-value is less than the level of significance.
That is,
Thus, the decision is “reject the null hypothesis”.
Therefore, the data provide sufficient evidence to conclude that the addition of the 4StarRank is significant.
State the test hypotheses.
Null hypothesis:
That is, the addition of the 5StarRank is not significant.
Alternative hypothesis:
That is, the addition of the 5StarRank is significant.
From the output, it is found that the t statistic corresponding to 5StarRank is 2.11 with df of 38 and the p value is 0.042.
Level of significance:
Assume the level of significance is
Rejection rule:
If the
Conclusion:
Here, the p-value is less than the level of significance.
That is,
Thus, the decision is “reject the null hypothesis”.
Therefore, the data provide sufficient evidence to conclude that the addition of the 5StarRank is significant.
Thus, all the independent variables are significant and no independent variables are deleted from the regression equation.
e.
Predict the 5-year average return for a domestic equality fund with an expense ratio of 1.05% and a 3-star Morningstar Rank.
Answer to Problem 56SE
The predicted the 5-year average return for a domestic equality fund with an expense ratio of 1.05% and a 3-star Morningstar Rank is 15.28%.
Explanation of Solution
Calculation:
According to part (d) the estimated regression equation that could be used to predict the 5-year average return given the type of fund, the expense ratio and the Morningstar Rank is
The 5-year average return for a domestic equality fund with an expense ratio of 1.05% and a 3-star Morningstar Rank implies that,
Thus, the predicted the 5-year average return for a domestic equality fund with an expense ratio of 1.05% and a 3-star Morningstar Rank is,
Thus, the predicted the 5-year average return for a domestic equality fund with an expense ratio of 1.05% and a 3-star Morningstar Rank is 15.28%.
Want to see more full solutions like this?
Chapter 15 Solutions
STATISTICS F/BUSINESS+ECONOMICS-TEXT


- Note: The purpose of this problem below is to use computational techniques (Excelspreadsheet, Matlab, R, Python, etc.) and code the dynamic programming ideas seen inclass. Please provide the numerical answer to the questions as well as a sample of yourwork (spreadsheet, code file, etc.).We consider an N-period binomial model with the following properties: N = 60, thecurrent stock price is S0 = 1000; on each period, the stock price increases by 0.5% whenit moves up and decreases by 0.3% when it moves down. The annual interest rate on themoney market is 5%. (Notice that this model is a CRR model, which means that thebinomial tree is recombining.)(a) Find the price at time t0 = 0 of a (European) call option with strike price K = 1040and maturity T = 1 year.(b) Find the price at time t0 = 0 of a (European) put option with strike price K = 1040and maturity T = 1 year.(c) We consider now, that you are at time t5 (i.e. after 5 periods, which represents 1month later). Assume that the stock…arrow_forwardshow work in paperarrow_forwardshow all work (...or what you entered into your calculator...)arrow_forward
- answerarrow_forwardQuestion 2 The data below provides the battery life of thirty eight (38) motorcycle batteries. 100 83 83 105 110 81 114 99 101 105 78 115 74 96 106 89 94 81 106 91 93 86 79 103 94 108 113 100 117 120 77 93 93 85 76 89 78 88 680 a. Test the hypothesis that mean battery life is greater than 90. Use the 1% level of significance. b. Determine if the mean battery life is different from 80. Use the 10% level of significance. Show all steps for the hypothesis test c. Would your conlcusion in part (b) change at the 5% level of significance? | d. Confirm test results in part (b) using JASP. Note: All JASP input files and output tables should be providedarrow_forwardSuppose that 80% of athletes at a certain college graduate. You randomly select eight athletes. What’s the chance that at most 7 of them graduate?arrow_forward
- Suppose that you flip a fair coin four times. What’s the chance of getting at least one head?arrow_forwardSuppose that the chance that an elementary student eats hot lunch is 30 percent. What’s the chance that, among 20 randomly selected students, between 6 and 8 students eat hot lunch (inclusive)?arrow_forwardBob’s commuting times to work are varied. He makes it to work on time 80 percent of the time. On 12 randomly selected trips to work, what’s the chance that Bob makes it on time at least 10 times?arrow_forward
- Your chance of winning a small prize in a scratch-off ticket is 10 percent. You buy five tickets. What’s the chance you will win at least one prize?arrow_forwardSuppose that 60 percent of families own a pet. You randomly sample four families. What is the chance that two or three of them own a pet?arrow_forwardIf 40 percent of university students purchase their textbooks online, in a random sample of five students, what’s the chance that exactly one of them purchased their textbooks online?arrow_forward
 Glencoe Algebra 1, Student Edition, 9780079039897...AlgebraISBN:9780079039897Author:CarterPublisher:McGraw Hill