Videos
The following excerpt is from Coca-Cola Company’s 2014 annual report filed with the SEC:
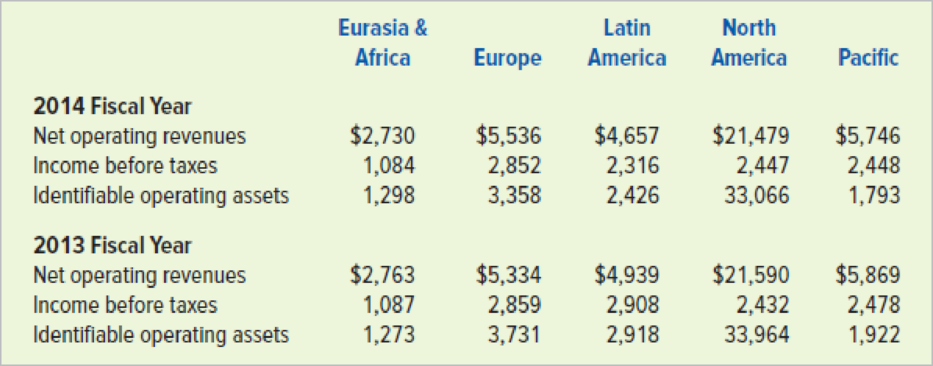
Management evaluates the performance of our operating segments separately to individually monitor the different factors affecting financial performance. Our Company manages income taxes and certain treasury-related items, such as interest income and expense, on a global basis within the Corporate operating segment. We evaluate segment performance based on income or loss before income taxes.
Below are selected segment data for Coca-Cola Company for the 2014 and 2013 fiscal years. Dollar amounts are in millions.
Required
- a. Compute the
ROI for each of Coke’s geographical segments for each fiscal year. Which segment appears to have the best performance during 2014 based their ROIs? Which segment showed the most improvement from 2013 to 2014? - b. Assuming Coke’s management expects a minimum return of 30 percent, calculate the residual income for each segment for each fiscal year. Which segment appears to have the best performance based on residual income? Which segment showed the most improvement from 2013 to 2014?
- c. Explain why the segment with the highest ROI in 2013 was not the segment with the highest residual income.
- d. Assume the management of Coke is considering a major expansion effort for the next five years. On which geographic segment would you recommend Coke focus its expansion efforts? Explain the rationale for your answer.
a.
Ascertain the return on investment (ROI) for each of the geographical segments of Company CC for the years 2014 and 2013, indicate the segment that has performed well in 2014, based on the ROI, and indicate the segment that has improved from 2013 to 2014.
Explanation of Solution
Return on investment (ROI): This financial ratio evaluates how efficiently the assets are used in earning income from operations. So, ROI is a tool used to measure and compare the performance of a units or divisions of companies.
Formula of ROI:
Ascertain the ROI of Segment EA for the years 2013 and 2014.
| Particulars | 2013 | 2014 |
| Income before taxes | $1,087,000,000 | $1,084,000,000 |
| Identifiable operating assets | ÷ 1,273,000,000 | ÷ 1,298,000,000 |
| ROI | 85.4% | 83.5% |
Table (1)
Ascertain the ROI of Segment E for the years 2013 and 2014.
| Particulars | 2013 | 2014 |
| Income before taxes | $2,859,000,000 | $2,852,000,000 |
| Identifiable operating assets | ÷ 3,713,000,000 | ÷ 3,358,000,000 |
| ROI | 77.0% | 84.9% |
Table (2)
Ascertain the ROI of Segment LA for the years 2013 and 2014.
| Particulars | 2013 | 2014 |
| Income before taxes | $2,908,000,000 | $2,316,000,000 |
| Identifiable operating assets | ÷ 2,918,000,000 | ÷ 2,426,000,000 |
| ROI | 99.7% | 95.5% |
Table (3)
Ascertain the ROI of Segment NA for the years 2013 and 2014.
| Particulars | 2013 | 2014 |
| Income before taxes | $2,432,000,000 | $2,447,000,000 |
| Identifiable operating assets | ÷ 33,964,000,000 | ÷ 33,066,000,000 |
| ROI | 7.2% | 7.4% |
Table (4)
Ascertain the ROI of Segment P for the years 2013 and 2014.
| Particulars | 2013 | 2014 |
| Income before taxes | $2,478,000,000 | $2,448,000,000 |
| Identifiable operating assets | ÷ 1,922,000,000 | ÷ 1,793,000,000 |
| ROI | 128.9% | 136.5% |
Table (5)
Analysis: Of all segments, Segment P has performed well in 2014, with the highest ROI of 136.5%. Segments E, NA, and P have improved from 2013 to 2014.
b.
Ascertain the residual income for each of the geographical segments of Company CC for the years 2014 and 2013, indicate the segment that has performed well in 2014, based on the ROI, and indicate the segment that has improved from 2013 to 2014.
Explanation of Solution
Residual income: The excess of income from operations over the desired acceptable income is referred to as residual income.
Formula of residual income:
Ascertain the residual income for each of the geographical segments of Company CC for the years 2013 (amount in millions).
| Segment | Income Before Taxes | ˗ | = | Residual Income | |
| EA | $1,087 | ˗ | = | $705 | |
| E | 2,859 | ˗ | = | 1,745 | |
| LA | 2,908 | ˗ | = | 2,033 | |
| NA | 2,432 | ˗ | = | (7,757) | |
| P | 2,478 | ˗ | = | 1,901 |
Table (6)
Ascertain the residual income for each of the geographical segments of Company CC for the years 2014 (amount in millions).
| Segment | Income Before Taxes | ˗ | = | Residual Income | |
| EA | $1,084 | ˗ | = | $695 | |
| E | 2,852 | ˗ | = | 1,845 | |
| LA | 2,316 | ˗ | = | 1,588 | |
| NA | 2,447 | ˗ | = | (7,743) | |
| P | 2,448 | ˗ | = | 1,910 |
Table (7)
Analysis: Of all segments, Segment P has performed well in 2014, with the highest residual income of $1,910 million, and Segment LA performed well in 2013, with highest residual income of $2,033 million. Segments E, NA, and P have improved from 2013 to 2014, but Segment E has improved the most.
c.
Explain the reason for the segment with highest ROI in 2013, was not the segment with highest residual income.
Explanation of Solution
Reason: Residual income depends on the operating assets value. Since Segment P had more operating assets, the residual income was lower in 2013, despite highest ROI.
d.
Indicate the segment that stands as the best investment opportunity for Company CC, and give reasons.
Explanation of Solution
Best investment opportunity: Segment P would be the best segment for the investment opportunity for Company CC, based on the ROI. Company CC should consider the non-quantitative factors too before investing in Segment P.
Want to see more full solutions like this?
Chapter 15 Solutions
SURVEY OF ACCOUNTING(LL)>CUSTOM PKG.<


- I need help with this financial accounting problem using accurate calculation methods.arrow_forwardCan you provide the valid approach to solving this financial accounting question with suitable standards?arrow_forwardPlease explain the accurate process for solving this financial accounting question with proper principles.arrow_forward
 Principles of Accounting Volume 2AccountingISBN:9781947172609Author:OpenStaxPublisher:OpenStax College
 Financial Reporting, Financial Statement Analysis...FinanceISBN:9781285190907Author:James M. Wahlen, Stephen P. Baginski, Mark BradshawPublisher:Cengage Learning
 Cornerstones of Cost Management (Cornerstones Ser...AccountingISBN:9781305970663Author:Don R. Hansen, Maryanne M. MowenPublisher:Cengage Learning
 Managerial AccountingAccountingISBN:9781337912020Author:Carl Warren, Ph.d. Cma William B. TaylerPublisher:South-Western College Pub
 Principles of Cost AccountingAccountingISBN:9781305087408Author:Edward J. Vanderbeck, Maria R. MitchellPublisher:Cengage Learning