Concept explainers
Videos
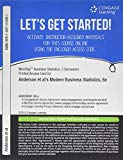
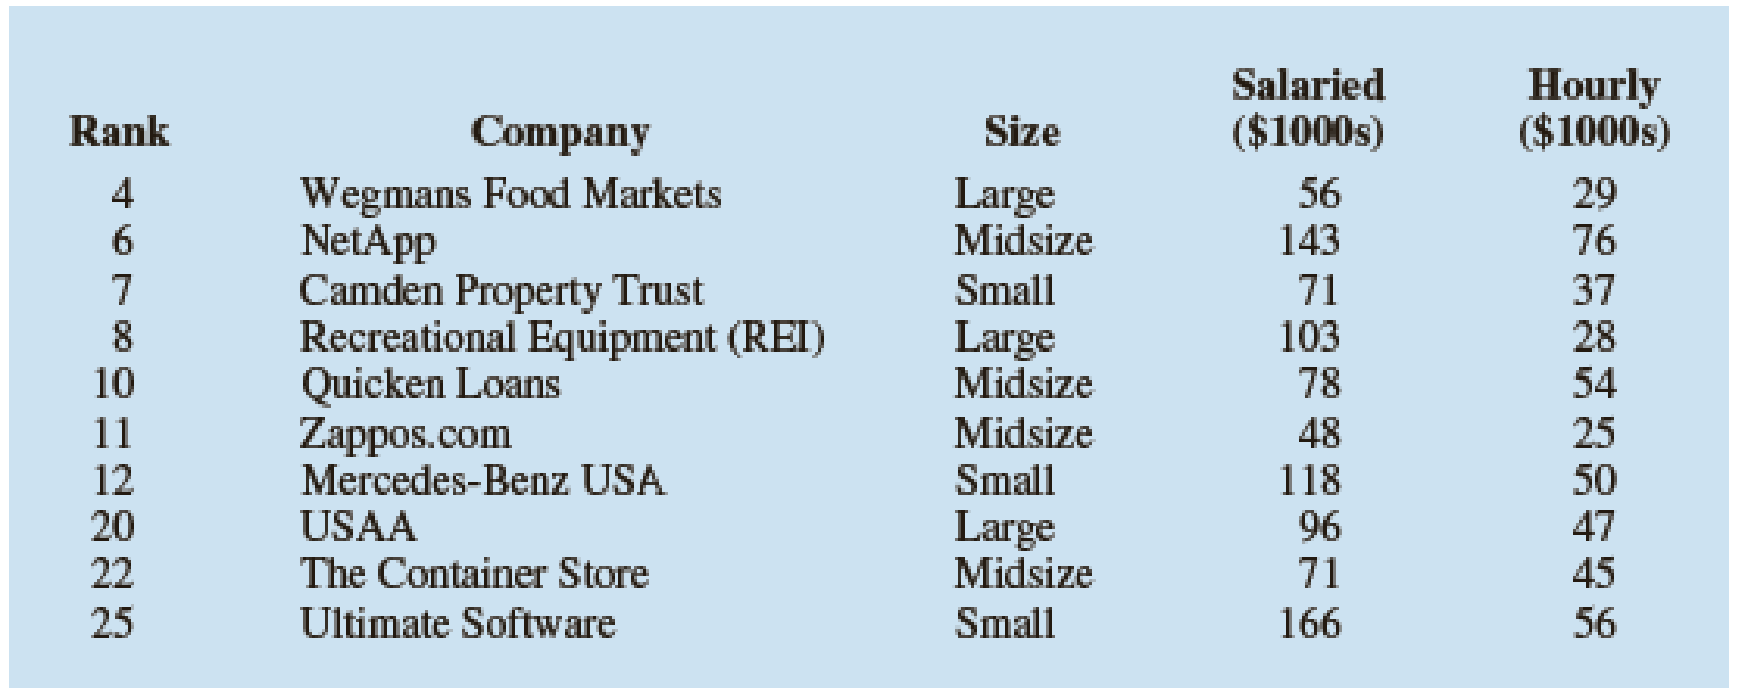
Fortune magazine publishes an annual list of the 100 best companies to work for. The data in the DATAfile named FortuneBest shows a portion of the data for a random sample of 30 of the companies that made the top 100 list for 2012 (Fortune, February 6, 2012). The column labeled Rank shows the rank of the company in the Fortune 100 list; the column labeled Size indicates whether the company is a small, midsize, or large company; the column labeled Salaried ($1000s) shows the average annual salary for salaried employees rounded to the nearest $1000; and the column labeled Hourly ($1000s) shows the average annual salary for hourly employees rounded to the nearest $1000. Fortune defines large companies as having more than 10,000 employees, midsize companies as having between 2500 and 10,000 employees, and small companies as having fewer than 2500 employees.
- a. Use these data to develop an estimated regression equation that could be used to predict the average annual salary for salaried employees given the average annual salary for hourly employees.
- b. Use α = .05 to test for overall significance.
- c. To incorporate the effect of size, a categorical variable with three levels, we used two dummy variables: Size-Midsize and Size-Small. The value of Size-Midsize = 1 if the company is a midsize company and 0 otherwise. And the value of Size-Small = 1 if the company is a small company and 0 otherwise. Develop an estimated regression equation that could be used to predict the average annual salary for salaried employees given the average annual salary for hourly employees and the size of the company.
- d. For the estimated regression equation developed in part (c), use the t test to determine the significance of the independent variables. Use α = .05.
- e. Based upon your findings in part (d), develop an estimated regression equation that can be used to predict the average annual salary for salaried employees given the average annual salary for hourly employees and the size of the company.

Trending nowThis is a popular solution!

Chapter 15 Solutions
MindTap Business Statistics, 2 terms (12 months) Printed Access Card for Anderson/Sweeney/Williams/Camm/Cochran’s Modern Business Statistics with Microsoft Office Excel, 6th (MindTap Course List)


- Assume you are a loyal member of Costco. You have been expecting your membership reward from the company, and you just received a text message on your mobile phone. The message appears to be from Costco: Costco - Your 3% return is ready: costco.wholesaledividend.com Before clicking the link in the message, you consider whether this is genuinely from Costco or a phishing attack on you. How can you tell? If it is a phishing attack, what mechanism was most likely used to send the message to you? What actions can you take if you are not sure whether it is a genuine message from Costco? What actions can you take if you are sure this is a phishing attack?arrow_forwardRSA and Diffie-Hellman are important algorithms in public-key cryptography. What are the differences between the two? Assume you intercept the ciphertext C = 105 sent to a user whose public key is e = 7, n = 403. Explain in detail how you will find the private key of the user and crack the ciphertext. What is the plaintext M?arrow_forwardCBC-Pad is a block cipher mode of operation commonly used in block ciphers. CBC-Pad handles plain text of any length. Padding is used to ensure that the plaintext input is a multiple of the block length. Hence, the ciphertext is longer than the plaintext by at most the size of a single block.Assume that the original plaintext is 556 bytes and the size of a cipher block is 28 bytes. What will be the padding? If the original plaintext is an integer multiple of the block size, will padding still be needed? Why or why not?arrow_forward
- Abstract classes & Interfaces (Ch13) 5. See the code below and solve the following. class Circle { protected double radius; // Default constructor public Circle() ( } this(1.0); // Construct circle with specified radius public Circle(double radius) { } this.radius radius; // Getter method for radius public double getRadius() { } return radius; // Setter method for radius public void setRadius(double radius) { } this.radius = radius; // Implement the findArea method defined in GeometricObject public double findArea() { } return radius* radius * Math. PI; // Implement the find Perimeter method defined in GeometricObject public double findPerimeter() { } return 2*radius*Math.PI; // Override the equals() method defined in the Object class public boolean equals(Circlel circle) { } return this.radius == circle.getRadius(); // Override the toString() method defined in the Object class public String toString() { } } return "[Circle] radius = " + radius; 5-1. Define a class name…arrow_forward6. What is Race condition? How to prevent it? [2 marks] 7. How many synchronization methods do you know and compare the differences. [2 marks] 8. Explain what are the “mutual exclusion”, “deadlock”, “livelock”, and “eventual entry”, with the traffic intersection as an example like dinning philosophy. [2 marks] 9. For memory allocation, what are the difference between internal fragmentation and external fragmentation. Explain with an example. [2 marks] 10. How can the virtual memory map to the physical memory. Explain with an example. [2 marks]arrow_forwardYour answers normally have 50 words. Less than 50 words will not get marks. 1. What is context switch between multiple processes? [2 marks] 2. Draw the memory layout for a C program. [2 marks] 3. How many states does a process has? [2 marks] 4. Compare the non-preemptitve scheduling and preemptive scheduling. [2 marks] 5. Given 4 process and their arrival times and next CPU burst times, what are the average times and average Turnaround time, for different scheduling algorithms including: a. First Come, First-Served (FCFS) Scheduling [2 marks] b. Shortest-Job-First (SJF) Scheduling [2 marks] c. Shortest-remaining-time-first [2 marks] d. Priority Scheduling [2 marks] e. Round Robin (RR) [2 marks] Process Arrival Time Burst Time P1 0 8 P2 1 9 P3 3 2 P4 5 4arrow_forward
- a database with multiple tables from attributes as shown above that are in 3NF, showing PK, non-key attributes, and FK for each table? Assume the tables are already in 1NF. [Hint: 3 tables will result after deducing 1NF -> 2NF -> 3NF]arrow_forwarda database with multiple tables from attributes as shown above that are in 3NF, showing PK, non-key attributes, and FK for each table? Assume the tables are already in 1NF. [Hint: 3 tables will result after deducing 1NF -> 2NF -> 3NF]arrow_forwardIf a new entity Order_Details is introduced, will it be a strong entity or weak entity? If it is a weak entity, then mention its type (ID or Non-ID, also Justify why)?arrow_forward
- Which one of the 4 Entities mention in the diagram can have a recursive relationship? Order, Product, store, customer.arrow_forwardInheritance & Polymorphism (Ch11) There are 6 classes including Person, Student, Employee, Faculty, and Staff. 4. Problem Description: • • Design a class named Person and its two subclasses named student and Employee. • Make Faculty and Staff subclasses of Employee. • A person has a name, address, phone number, and e-mail address. • • • A person has a class status (freshman, sophomore, junior and senior). Define the status as a constant. An employee has an office, salary, and date hired. A faculty member has office hours and a rank. A staff member has a title. Override the toString() method in each class to display the class name and the person's name. 4-1. Explain on how you would code this program. (1 point) 4-2. Implement the program. (2 point) 4-3. Explain your code. (2 point)arrow_forwardSuppose you buy an electronic device that you operate continuously. The device costs you $300 and carries a one-year warranty. The warranty states that if the device fails during its first year of use, you get a new device for no cost, and this new device carries exactly the same warranty. However, if it fails after the first year of use, the warranty is of no value. You plan to use this device for the next six years. Therefore, any time the device fails outside its warranty period, you will pay $300 for another device of the same kind. (We assume the price does not increase during the six-year period.) The time until failure for a device is gamma distributed with parameters α = 2 and β = 0.5. (This implies a mean of one year.) Use @RISK to simulate the six-year period. Include as outputs (1) your total cost, (2) the number of failures during the warranty period, and (3) the number of devices you own during the six-year period. Your expected total cost to the nearest $100 is _________,…arrow_forward
 Np Ms Office 365/Excel 2016 I NtermedComputer ScienceISBN:9781337508841Author:CareyPublisher:Cengage
 A Guide to SQLComputer ScienceISBN:9781111527273Author:Philip J. PrattPublisher:Course Technology Ptr
 Programming with Microsoft Visual Basic 2017Computer ScienceISBN:9781337102124Author:Diane ZakPublisher:Cengage LearningCOMPREHENSIVE MICROSOFT OFFICE 365 EXCEComputer ScienceISBN:9780357392676Author:FREUND, StevenPublisher:CENGAGE L