Videos
In the gas phase, acetic acid exists as an equilibrium of monomer and dimer molecules. (The dimer consists of two molecules linked through hydrogen bonds.)
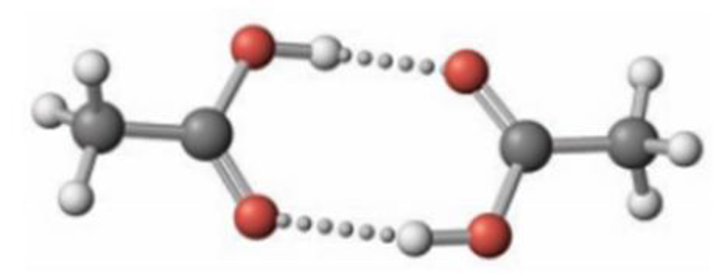
The equilibrium constant, Kc, at 25 °C for the monomer-dimer equilibrium
2 CH3CO2H ⇄ (CH3CO2H)2
has been determined to be 3.2 × 10⁴. Assume that acetic acid is present initially at a concentration of 5.4 × 10⁻⁴ mol/L at 25 °C and that no dimer is present initially.
(a) What percentage of the acetic acid is converted to dimer?
(b) As the temperature increases, in which direction does the equilibrium shift? (Recall that hydrogen-bond formation is an exothermic process.)

Trending nowThis is a popular solution!

Chapter 15 Solutions
Chemistry & Chemical Reactivity
Additional Science Textbook Solutions
Fundamentals Of Thermodynamics
Organic Chemistry (8th Edition)
Chemistry: Structure and Properties (2nd Edition)
Microbiology Fundamentals: A Clinical Approach


- helparrow_forwardThe temperature on a sample of pure X held at 1.25 atm and -54. °C is increased until the sample boils. The temperature is then held constant and the pressure is decreased by 0.42 atm. On the phase diagram below draw a path that shows this set of changes. pressure (atm) 2 0 0 200 400 temperature (K) Xarrow_forwardQUESTION: Answer Question 5: 'Calculating standard error of regression' STEP 1 by filling in all the empty green boxes *The values are all provided in the photo attached*arrow_forward
- pressure (atm) 3 The pressure on a sample of pure X held at 47. °C and 0.88 atm is increased until the sample condenses. The pressure is then held constant and the temperature is decreased by 82. °C. On the phase diagram below draw a path that shows this set of changes. 0 0 200 temperature (K) 400 аarrow_forwarder your payment details | bar xb Home | bartleby x + aleksogi/x/isl.exe/1o u-lgNskr7j8P3jH-1Qs_pBanHhviTCeeBZbufuBYT0Hz7m7D3ZcW81NC1d8Kzb4srFik1OUFhKMUXzhGpw7k1 O States of Matter Sketching a described thermodynamic change on a phase diagram 0/5 The pressure on a sample of pure X held at 47. °C and 0.88 atm is increased until the sample condenses. The pressure is then held constant and the temperature is decreased by 82. °C. On the phase diagram below draw a path that shows this set of changes. pressure (atm) 1 3- 0- 0 200 Explanation Check temperature (K) 400 X Q Search L G 2025 McGraw Hill LLC. All Rights Reserved Terms of Use Privacy Cearrow_forward5.arrow_forward
- 6.arrow_forward0/5 alekscgi/x/sl.exe/1o_u-IgNglkr7j8P3jH-IQs_pBaHhvlTCeeBZbufuBYTi0Hz7m7D3ZcSLEFovsXaorzoFtUs | AbtAURtkqzol 1HRAS286, O States of Matter Sketching a described thermodynamic change on a phase diagram The pressure on a sample of pure X held at 47. °C and 0.88 atm is increased until the sample condenses. The pressure is then held constant and the temperature is decreased by 82. °C. On the phase diagram below draw a path that shows this set of changes. 3 pressure (atm) + 0- 0 5+ 200 temperature (K) 400 Explanation Check X 0+ F3 F4 F5 F6 F7 S 2025 McGraw Hill LLC All Rights Reserved. Terms of Use Privacy Center Accessibility Q Search LUCR + F8 F9 F10 F11 F12 * % & ( 5 6 7 8 9 Y'S Dele Insert PrtSc + Backsarrow_forward5.arrow_forward
- 9arrow_forwardalekscgi/x/lsl.exe/1o_u-IgNslkr7j8P3jH-IQs_pBanHhvlTCeeBZbufu BYTI0Hz7m7D3ZS18w-nDB10538ZsAtmorZoFusYj2Xu9b78gZo- O States of Matter Sketching a described thermodynamic change on a phase diagram 0/5 The pressure on a sample of pure X held at 47. °C and 0.88 atm is increased until the sample condenses. The pressure is then held constant and the temperature is decreased by 82. °C. On the phase diagram below draw a path that shows this set of changes. pressure (atm) 3- 200 temperature (K) Explanation Chick Q Sowncharrow_forward0+ aleksog/x/lsl.exe/1ou-lgNgkr7j8P3H-IQs pBaHhviTCeeBZbufuBYTOHz7m7D3ZStEPTBSB3u9bsp3Da pl19qomOXLhvWbH9wmXW5zm O States of Matter Sketching a described thermodynamic change on a phase diagram 0/5 Gab The temperature on a sample of pure X held at 0.75 atm and -229. °C is increased until the sample sublimes. The temperature is then held constant and the pressure is decreased by 0.50 atm. On the phase diagram below draw a path that shows this set of changes. F3 pressure (atm) 0- 0 200 Explanation temperature (K) Check F4 F5 ☀+ Q Search Chill Will an 9 ENG F6 F7 F8 F9 8 Delete F10 F11 F12 Insert PrtSc 114 d Ararrow_forward
 Chemistry: The Molecular ScienceChemistryISBN:9781285199047Author:John W. Moore, Conrad L. StanitskiPublisher:Cengage Learning
 Chemistry by OpenStax (2015-05-04)ChemistryISBN:9781938168390Author:Klaus Theopold, Richard H Langley, Paul Flowers, William R. Robinson, Mark BlaserPublisher:OpenStax
 Introductory Chemistry: A FoundationChemistryISBN:9781285199030Author:Steven S. Zumdahl, Donald J. DeCostePublisher:Cengage Learning
 Chemistry: Principles and ReactionsChemistryISBN:9781305079373Author:William L. Masterton, Cecile N. HurleyPublisher:Cengage Learning
 Chemistry & Chemical ReactivityChemistryISBN:9781337399074Author:John C. Kotz, Paul M. Treichel, John Townsend, David TreichelPublisher:Cengage Learning
 ChemistryChemistryISBN:9781305957404Author:Steven S. Zumdahl, Susan A. Zumdahl, Donald J. DeCostePublisher:Cengage Learning