Concept explainers
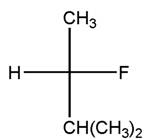
(a)
Interpretation:
Three-dimensional representation of a given Fischer projection should be drawn.

Concept Introduction:
Fischer Projection is a method of drawing 3-D structures of organic molecules using cross formula. In this method, all non-terminal bonds are depicted as horizontal or vertical lines.
In the Fischer projection, horizontal bonds represent groups coming forward (drawn as wedges) and vertical bonds represent groups going backward (drawn as dashed wedges).
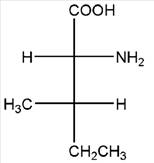
(b)
Interpretation:
Three-dimensional representation of a given Fischer projection should be drawn.

Concept Introduction:
Fischer Projection is a method of drawing 3-D structures of organic molecules using cross formula. In this method, all non-terminal bonds are depicted as horizontal or vertical lines.
In the Fischer projection, horizontal bonds represent groups coming forward (drawn as wedges) and vertical bonds represent groups going backward (drawn as dashed wedges).
Want to see the full answer?
Check out a sample textbook solution
Chapter 15 Solutions
Loose Leaf for General, Organic and Biological Chemistry with Connect 2 Year Access Card
- consider the rate of the reaction below to be r. Whats the rate after each reaction? Br + NaCN CN + NaBr a. Double the concentration of alkyl bromide b. Halve the concentration of the electrophile & triple concentration of cyanide c. Halve the concentration of alkyl chloridearrow_forwardPredict the organic reactant that is involved in the reaction below, and draw the skeletal ("line") structures of the missing organic reactant. Please include all steps & drawings & explanations.arrow_forwardWhat are the missing reagents for the spots labeled 1 and 3? Please give a detailed explanation and include the drawings and show how the synthesis proceeds with the reagents.arrow_forward
- What is the organic molecule X of the following acetal hydrolysis? Please draw a skeletal line structure and include a detailed explanation and drawing of how the mechanism proceeds. Please include any relevant information that is needed to understand the process of acetal hydrolysis.arrow_forwardWhat are is the organic molecule X and product Y of the following acetal hydrolysis? Please draw a skeletal line structure and include a detailed explanation and drawing of how the mechanism proceeds. Please include any relevant information that is needed to understand the process of acetal hydrolysis.arrow_forwardAt 300 K, in the decomposition reaction of a reactant R into products, several measurements of the concentration of R over time have been made (see table). Without using graphs, calculate the order of the reaction. t/s [R]/(mol L-1) 0 0,5 171 0,16 720 0,05 1400 0,027arrow_forward
- Predict the organic products that form in the reaction below, and draw the skeletal ("line") structures of the missing organic products. Please include all steps & drawings & explanations.arrow_forwardWhat are the missing reagents for the spots labeled 1 and 3? Please give a detailed explanation and include the drawings and show how the synthesis proceeds with the reagents.arrow_forwardWhat are the products of the following acetal hydrolysis? Please draw a skeletal line structure and include a detailed explanation and drawing of how the mechanism proceeds. Please include any relevant information that is needed to understand the process of acetal hydrolysis.arrow_forward
- What would happen if you added the HCI to the Grignard reagent before adding benzophenone? Draw a reaction mechanism to support your answer.arrow_forwardAt 300 K, in the decomposition reaction of a reactant R into products, several measurements of the concentration of R over time have been made (see table). Calculate the order of the reaction. t/s [R]/ (mol L-1) 0 0,5 171 0,16 720 0,05 1400 0,027arrow_forwardWrite the correct IUPAC names of the molecules in the picturearrow_forward
 Organic Chemistry: A Guided InquiryChemistryISBN:9780618974122Author:Andrei StraumanisPublisher:Cengage Learning
 Chemistry for Today: General, Organic, and Bioche...ChemistryISBN:9781305960060Author:Spencer L. Seager, Michael R. Slabaugh, Maren S. HansenPublisher:Cengage Learning


