
Concept explainers
Sub part (a):
The monopsony market.
Sub part (a):
Explanation of Solution
The total labor cost can be calculated by using the following formula.
Substitute the respective value in the equation (1) to calculate the total labor cost at one unit of labor.
The total labor cost is $3.
The marginal resource cost can be calculated by using the following formula.
Substitute the respective values in the equation (2) to calculate the marginal resource cost at one unit of labor.
The marginal resource cost is $3.
Table -1 shows the value of the total labor cost and the marginal resources cost that are obtained by using the equation (1) and (2).
Table -1
| Units of labor | Wage rate | Total labor cost | Marginal resources cost |
| 0 | - | 0 | |
| 1 | 6 | 6 | 6 |
| 2 | 9 | 18 | 12 |
| 3 | 12 | 36 | 18 |
| 4 | 15 | 60 | 24 |
| 5 | 18 | 90 | 30 |
| 6 | 21 | 120 | 36 |
The total revenue can be calculated by using the following formula.
The
Substitute the respective value in the equation (3) to calculate the total revenue at one unit of labor.
The total revenue is $34.
The marginal product can be calculated by using the following formula.
Substitute the respective values in the equation (4) to calculate the marginal resource cost at one unit of labor.
The marginal product is $17.
The marginal revenue product can be calculated by using the following formula.
The
Substitute the respective values in the equation (5) to calculate the marginal revenue product.
The marginal revenue product is $34.
Table -2 shows the value of the total revenue, the marginal revenue product and the marginal product that is obtained by using the equation (3), (4) and (5).
Table -2
| Units of labor | Total product | Marginal product | Product price | Total revenue | Marginal revenue product |
| 0 | 0 | 2 | 0 | ||
| 1 | 17 | 17 | 2 | 34 | 34 |
| 2 | 31 | 14 | 2 | 62 | 28 |
| 3 | 43 | 12 | 2 | 86 | 24 |
| 4 | 53 | 10 | 2 | 106 | 20 |
| 5 | 60 | 7 | 2 | 120 | 14 |
| 6 | 65 | 5 | 2 | 130 | 10 |
Graph -1 shows the firms labor supply and the marginal resources cost.7
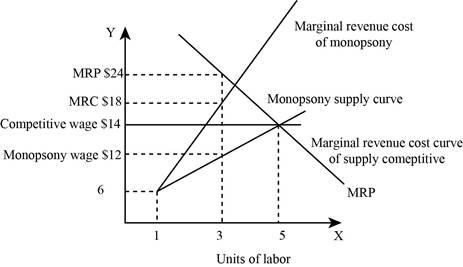
In graph -1, the horizontal axis measures the units of labor and the vertical axis represents the wage rate. The discrete nature of problem requires that the (MRP) marginal revenue product should be equal or greater than the marginal resources cost. This marginal revenue cost curve lies above the labor supply because the employing of the next worker needs a higher wage in the market and will have to pay a higher wage for all the workers.
Concept introduction:
Monopsony: The monopsony market refers to a market which consists of a single buyer who hires a particular type of labor. The workers provide labor to this type of market that has a limited employment opportunity as they need to acquire new skills to be hired. The firm is the wage marker.
Subpart (b):
How many workers should the firm employ.
Subpart (b):
Answer to Problem 3P
The firm should employ 3 workers.
Explanation of Solution
When the marginal revenue product for this worker is greater than the marginal cost, then the firm should employ the workers. From the table, the firm should employ three workers. For the first worker, the marginal revenue product is $34 and the marginal revenue cost is $6. Thus, the firm should employ the first worker. For the second worker, the marginal revenue product is $28 and the marginal revenue cost is $12. So, the firm should employ the second worker. For the third worker, the marginal revenue product is $24 and the marginal revenue cost is $18. So the firm should employ the third worker. But for the fourth worker, the marginal revenue product is $20 and the marginal revenue cost is $24. So, the firm should not employ the forth worker.
Subpart (c):
What happens to the monopolist employment and equilibrium wage rate.
Subpart (c):
Explanation of Solution
In this, the monopolist employment decreases by 2 units and the equilibrium wage rate is $2 which is less than the competitive wage.
Want to see more full solutions like this?
Chapter 15 Solutions
EP ECONOMICS,AP EDITION-CONNECT ACCESS


- 3. Consider the market for paper. The process of producing paper creates pollution. Assume that the marginal damage function for pollution is given by: MDF = 3E where damages are measured in dollars and E is the level of emissions. Assume further that the function describing the marginal abatement cost of emissions is given by MAC 120-E where benefits are measured in dollars and E is the level of emissions. a. Graph the marginal damage function (MDF) and the marginal abatement cost function (MAC). b. What is the unregulated level of emissions Eu? What is the social welfare of this emissions level? c. Assume an existing emission quota limits emissions to E = 60. Show on the graph why this policy is inefficient. What is the deadweight loss caused by this policy?arrow_forwardshow written calculation for Barrow_forwardProblem 1: 1. If a stock is expected to pay an annual dividend of $20 forever, what is the approximate present value of the stock, given that the discount rate is 5%? 2. If a stock is expected to pay an annual dividend of $20 forever, what is the approximate present value of the stock, given that the discount rate is 8%? 3. If a stock is expected to pay an annual dividend of $20 this year, what is the approximate present value of the stock, given that the discount rate is 8% and dividends are expected to grow at a rate of 2% per year?arrow_forward
- d-farrow_forwardG please!arrow_forward4. Consider two polluting firms, with the marginal abatement costs of polluters 1 and 2, respectively, equal to MAC₁ = 20-E1 MAC2 = 12-E2 a. What is the unregulated level of pollution for each firm? b. Assume policymakers have decided to cut the level of pollution in half. The way they intend to accomplish this goal is to require both firms to cut their pollution in half. What are the total costs of abatement from the policy? And how are these costs distributed between the firms? c. Is this uniform quota on emissions across firms the most cost-effective manner in which to reduce emissions by 50%?arrow_forward
- Don't used hand raiting and don't used Ai solutionarrow_forwardThanks in advance!arrow_forwardI need help figuring this out. I'm pretty sure this is correct?If Zambia is open to international trade in oranges without any restrictions, it will import 180 tons of oranges.I can't figure these two out: 1) Suppose the Zambian government wants to reduce imports to exactly 60 tons of oranges to help domestic producers. A tariff of ???? per ton will achieve this. 2) A tariff set at this level would raise ????in revenue for the Zambian government.arrow_forward
- 16:10 ← BEC 3701 - Assignments-... KWAME NKRUMAH UNIVERSITY TEACHING FOR EXCELLENCE SCHOOL OF BUSINESS STUDIES DEPARTMENT OF ECONOMICS AND FINANCE ADVANCED MICRO-ECONOMICS (BEC 3701) Assignments INSTRUCTIONS: Check instructions below: LTE 1) Let u(q1,q2) = ln q₁ + q2 be the (direct) utility function, where q₁ and q2the two goods. Denote P₁ and P2 as the prices of those two goods and let M be per period money income. Derive each of the following: a) the ordinary or Marshallian demand functions q₁ = d₂ (P₁, P₂, M) for i = 1,2 [3 Marks] b) the compensated or Hicksian demand functions q₁ = h₂ (P₁, P2, M) for i = 1,2 [3 Marks] c) the Indirect Utility Function uº = v(P₁, P2, M) [3 Marks] d) the Expenditure Function E(P1, P2, U°) [3 Marks] e) Draw a diagram of the solution. There should be two graphs, one above the other; the first containing the indifference curves and budget constraint that characterize the solution to the consumer's choice problem; the second characterizing the demand…arrow_forwardHow would you answer the question in the News Wire “Future Living Standards”? Why?arrow_forwardal Problems (v) T (ix) F 1. Out of total number of 2807 women, who were interviewed for employment in a textile factory, 912 were from textile areas and the rest from non-textile areas. Amongst the married women, who belonged to textile areas, 347 were having some work experience and 173 did not have work experience, while for non-textile areas the corresponding figures were 199 and 670 respectively. The total number of women having no experience was 1841 of whom 311 resided in textile areas. Of the total number of women, 1418 were unmarried and of these the number of women having experience in the textile and non-textile areas was 254 and 166 respectively. Tabulate the above information. [CA. (Foundation), May 2000 Exactly (14) of the total employees of a sugar mill were these were married and one-halfarrow_forward


 Principles of Economics 2eEconomicsISBN:9781947172364Author:Steven A. Greenlaw; David ShapiroPublisher:OpenStax
 Managerial Economics: Applications, Strategies an...EconomicsISBN:9781305506381Author:James R. McGuigan, R. Charles Moyer, Frederick H.deB. HarrisPublisher:Cengage Learning
 Principles of MicroeconomicsEconomicsISBN:9781305156050Author:N. Gregory MankiwPublisher:Cengage Learning
 Microeconomics: Private and Public Choice (MindTa...EconomicsISBN:9781305506893Author:James D. Gwartney, Richard L. Stroup, Russell S. Sobel, David A. MacphersonPublisher:Cengage Learning