Concept explainers
CASE INTERNATIONAL ARRIVALS
The U.S. Department of Transportation publishes the number of international passengers that come through U.S. airports. The busiest airports for international travel are in New York (JFK), Miami (MIA), Los Angeles (LAX), Newark (EWR), and Chicago (ORD). The most popular destinations are London (LHR), Toronto (YYZ), Tokyo (NR), Frankfurt (FRA), and Paris (CDG).
Consider the data in the following table and answer these questions:
- 1. How would you estimate the passenger volume for the coming year?
- 2. What is the role of trends and seasonality?
- 3. What other variables do you expect to influence the number of international travelers?
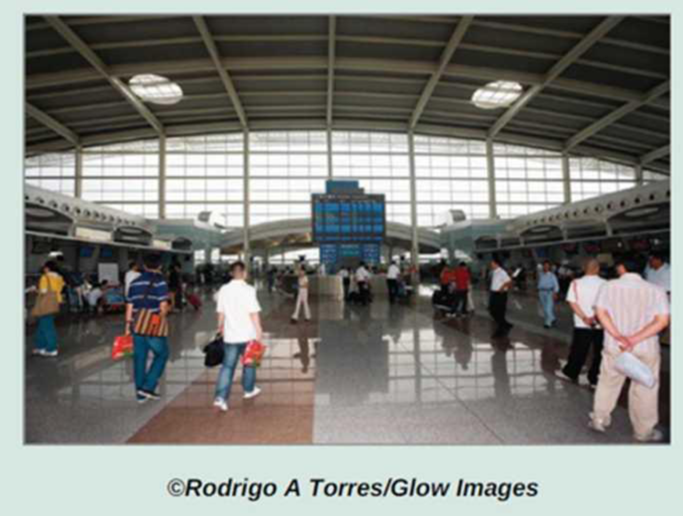
JFK Airport in New York, the airport with the most international travelers in the United States
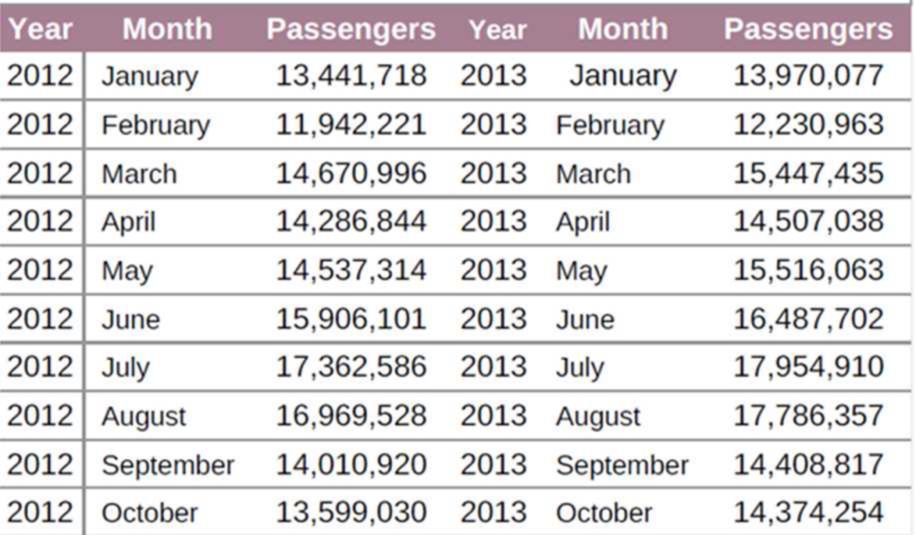
What is the role of trends and seasonality?
Want to see the full answer?
Check out a sample textbook solutionChapter 15 Solutions
OPERATION MANAGEMENT
Additional Business Textbook Solutions
Fundamentals of Management (10th Edition)
Fundamentals of Cost Accounting
Horngren's Cost Accounting: A Managerial Emphasis (16th Edition)
Operations Management: Processes and Supply Chains (12th Edition) (What's New in Operations Management)
Essentials of MIS (13th Edition)
Financial Accounting, Student Value Edition (5th Edition)
- ChocoTown has a 4,000 square foot outlet store that serves five major customer regions, denoted A, B, C, D and E. The locations of the points representing the customer regions and their weekly demands are shown in the table below. The ChocoTown outlet store is at location (10,20). Customer Region Location Demand ($/week) A (0,10) 4,000 B (0,20) 2,000 C (20,0) 4,000 D (30,20) 3,000 E (40,10) 2,000 CandyTime is a new competitor of ChocoTown and they are considering opening a 4,000 square foot store at location (30,10). Assume the travel time from location i to j in minutes equals the straight line distance from i to j. a) Use the spatial interaction model to estimate the demand that would be captured by the new CandyTime store. Demand captured by CandyTime = ___________ b) Suppose the CandyTime store is located at (30,10), but it is not 4,000 square feet. Use the spatial interaction model to find the size in square feet for…arrow_forwardJoburg Logistics (JL), a distributor of various products in Polokwane receives their products from suppliers in Durban, Cape Town, and Johannesburg. The company's management is concerned with the supply cost of a certain product that is supplied by a manufacturer in Durban. Currently JL has a contract with Transnet Freight Rail (TFR) for the transport of the orders from Durban. The following are the rail rate and transit time: Transit time (rail) Rail rate 5 days R2.75/unit The impact on the transport and inventory carrying cost because of this arrangement is a concern of the logistics director, Mrs Micky. As a result, Mrs Micky has requested the logistics manager to evaluate the option to use a 3PL service provider for the shipment from Durban to Johannesburg. The logistics manager has identified a certain 3PL company that has the capacity to perform this contract. However, in order to provide a transport rate, the 3PL company required the size and frequency of orders. JL currently…arrow_forwardCleveland Area Rapid Delivery (CARD) operates a delivery service in the Cleveland metropolitan area. Most of CARD's business involves rapid delivery of documents and parcels between offices during the business day. CARD promotes its ability to make fast and on-time deliveries anywhere in the metropolitan area. When a customer calls with a delivery request, CARD quotes a guaranteed delivery time. The following network shows the street routes available. The numbers above each arc indicate the travel time in minutes between the two locations. Min s.t. Node 1 Flows Node 2 Flows Node 3 Flows Node 4 Flows Node 5 Flows Node 6 Flows 35 For all X;; = 0, 1. (a) Develop a linear programming model that can be used to find the minimum time required to make a delivery from location 1 to location 6. (Express your answers in the form where each Xij represents the arc from node i to node j as either 1 or Xijr 0.) 30 12 p.m. 3 Need Help? Read It 18 15 39 12 16 5 (b) How long (in minutes) does it take to…arrow_forward
- Travelling Salesman Problem (TSP); Given the following distance matrix, use the nearest neighbor (NN) heuristic to find a route that starts from the warehouse (W), visits each customer only once, and finishes at the warehouse to minimize the distance traveled. What is the route and the corresponding distance? Distances W 1 2 3 4 in miles 18 57 27 50 18 0 65 29 61 57 65 0 36 99 3 27 29 36 0 76 4 50 61 99 76 Route=W-1-3-2-4, Distance=182 miles Route=W-3-1-2-4-W, Distance=270 miles Route = W-3-1-2-4, Distance=220 miles Route=W-1-3-2-4-W, Distance=232 miles Route=W-1-3-4-2, Distance=272 miles 1, 2.arrow_forwardSuppliers A, B, and C supply components to three plants -- F, G, and H via two transshipment facilities -- T1 and T2. It costs $4 to ship from T1 regardless of final destination and $3 to ship to T2 regardless of supplier. Shipping to T1 from A, B, and C costs $3, $4, and $5, respectively, and shipping from T2 to F, G, and H costs $10, $9, and $8, respectively. Suppliers A, B, and C can provide 200, 300 and 500 units respectively and plants F, G, and H need 350, 450, and 200 units respectively. The Logistics Manager has come to you for help. Answer the following question: Which of these is not an element of the objective function? Group of answer choices 4D-T1 600T1 9T2-G 3C-T2 Plz do fast asaparrow_forwardProvide an example of a Quantitative forecast in air cargo or other industry.arrow_forward
- John Clooney, a bush pilot in Alaska, makes regular charter flights in his floatplane to various towns and cities in western Alaska. His passengers include hunters, fishermen, backpackers and campers, and tradespeople hired for jobs in the different localities. He also carries some cargo for delivery. The following network shows the possible air routes between various towns and cities John might take (with the times, in hours). For safety reasons, he flies point-to-point, flying over at least one town along a route, even though he might not land there. In the upcoming week John has scheduled charter flights for Kotzebue, Nome, and Stebbins. Determine the shortest route between John’s home base in Anchorage and each of these destinations.arrow_forwardUse the table below to answer the following question(s). The Riviera Transport Company (RTC) produces car accessories at two plants: Dallas and Atlanta. They ship them to major distribution centers in Houston, San Jose, Jacksonville, and Memphis. The accounting, production, and marketing departments have provided the information in the table below, which shows the unit cost of shipping between any plant and distribution center, plant capacities over the next planning period, and distribution center demands. RTC's supply chain manager faces the problem of determining how much to ship between each plant and distribution center to minimize the total transportation cost, not exceed available capacity, and meet customer demand. Assume Xij = amount shipped from plant i to distribution center j, where i = 1 represents Dallas, i = 2 represents Atlanta, j = 1 represents Houston, and so on. Transportatio In Model Data Distribution Center Plant Houston Memphis 18.48 Dallas 13.00 Atlanta 10.75…arrow_forwardEurotronics manufactures components for use in small electronic products such as computers, CD players, and radios at plants in Belgium, Germany, and France. The parts are transported by truck to Hamburg, where they are shipped overseas to customers in Mexico, South America, the United States, and the Pacific Rim. The company has to reserve space on ships months and sometimes years in advance. This requires an accurate forecasting model. Following are the number of cubic feet of container space the company has used in each of the past 18 months: Month Space (1,000s ft.3) 1 10.6 2 12.7 3 9.8 4 11.3 5 13.6 6 14.4 7 12.2 8 16.7 9 18.1 10 19.2 11 16.3 12 14.7 13 18.2 14 19.6 15 21.4 16…arrow_forward
- The Tech power plant burns coal and natural gas to generate steam and electricity for all campus buildings. The annual coal consumption at the plant has increased annually for the past 6 years due to an aggressive campus building program. The following table shows the annual coal consumption: Year Coal Consumption (tons) 1 25000 2 23000 3 28000 4 35000 5 37000 6 42000 Develop a linear trend model to forecast coal consumption for the 7 th year. Don't answer by pen paper and don't use chatgpt otherwise we will give dounvotearrow_forwardSolve the following case study using the transportation method:Suppose there is a manufacturing company that produces and distributes its products to various customer locations across the country. This company has three production plants (Plant A, Plant B, and Plant C) located in different locations, and there are also five distribution centers (DC 1, DC 2, DC 3, DC 4, and DC 5) scattered across various regions. Sources Distribution Center DC 1 DC 2 DC 3 DC 4 Capacity Plant A $145 $150 $165 $140 2000 Plant B $175 $135 $120 $165 1250 Plant C $113 $156 $134 $148 1250 Demand 1000 1200 1400 900 The company's goal is to determine the most efficient transportation routes for delivering products from the plants to the distribution centers, considering transportation costs and available capacities.arrow_forwardWhat are the advantages of exponential smoothing over the moving average and the weighted moving average?arrow_forward
- Practical Management ScienceOperations ManagementISBN:9781337406659Author:WINSTON, Wayne L.Publisher:Cengage,Purchasing and Supply Chain ManagementOperations ManagementISBN:9781285869681Author:Robert M. Monczka, Robert B. Handfield, Larry C. Giunipero, James L. PattersonPublisher:Cengage Learning