Concept explainers
Find the reaction and plot the shear and bending moment diagram.
Explanation of Solution
Fixed end moment:
Formula to calculate the fixed moment for point load with equal length are
Formula to calculate the fixed moment for point load with unequal length are
Formula to calculate the fixed moment for UDL is
Calculation:
Consider flexural rigidity EI of the beam is constant.
Show the free body diagram of the entire beam as in Figure 1.
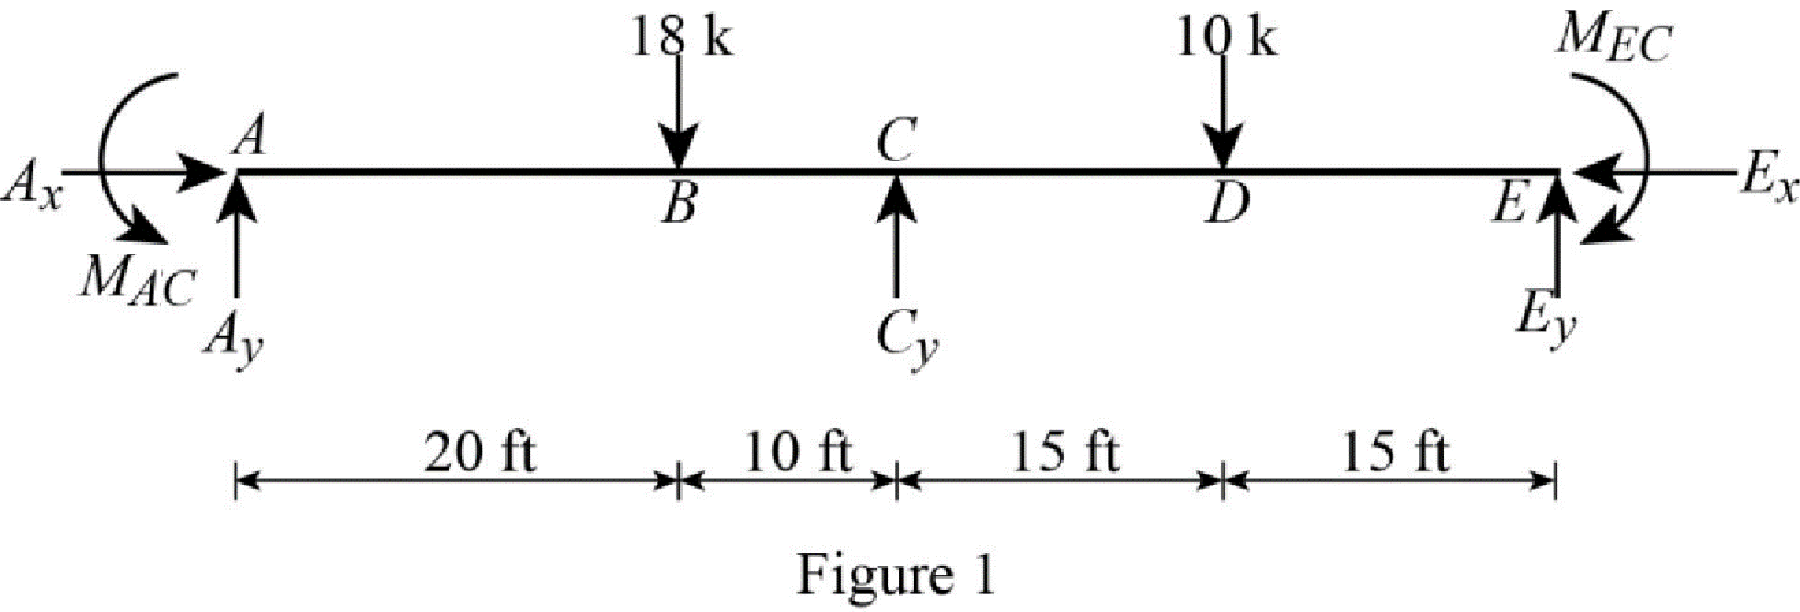
Refer Figure 1,
Calculate the fixed end moment for AC.
Calculate the fixed end moment for CA.
Calculate the fixed end moment for CE.
Calculate the fixed end moment for EC.
Calculate the slope deflection equation for the member AC.
Here,
Substitute 0 for
Calculate the slope deflection equation for the member CA.
Substitute 0 for
Calculate the slope deflection equation for the member CE.
Substitute 0 for
Calculate the slope deflection equation for the member EC.
Substitute 0 for
Write the equilibrium equation as below.
Substitute equation (2) and equation (3) in above equation.
Calculate the moment about AC.
Substitute
Calculate the moment about CA.
Substitute
Calculate the moment about CE.
Substitute
Calculate the moment about EC.
Substitute
Consider the member AC of the beam:
Show the free body diagram of the member AC as in Figure 2.
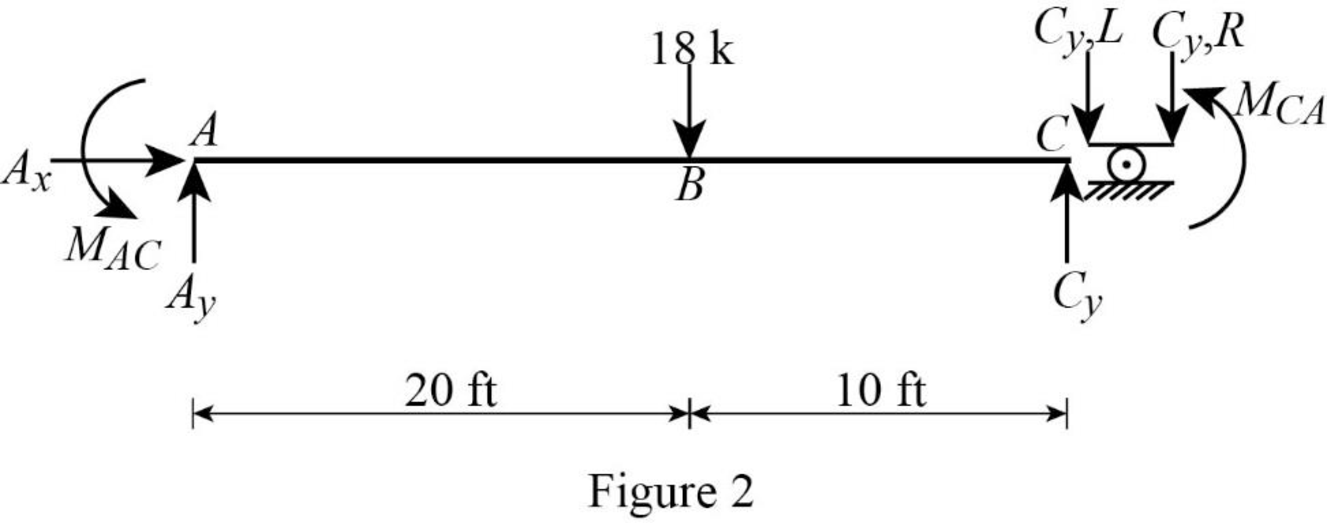
Calculate the vertical reaction at the left end of the joint C by taking moment about point A.
Calculate the horizontal reaction at point A by resolving the horizontal equilibrium.
Calculate the vertical reaction at point A by resolving the vertical equilibrium.
Consider the member CE of the beam:
Show the free body diagram of the member CE as in Figure 2.
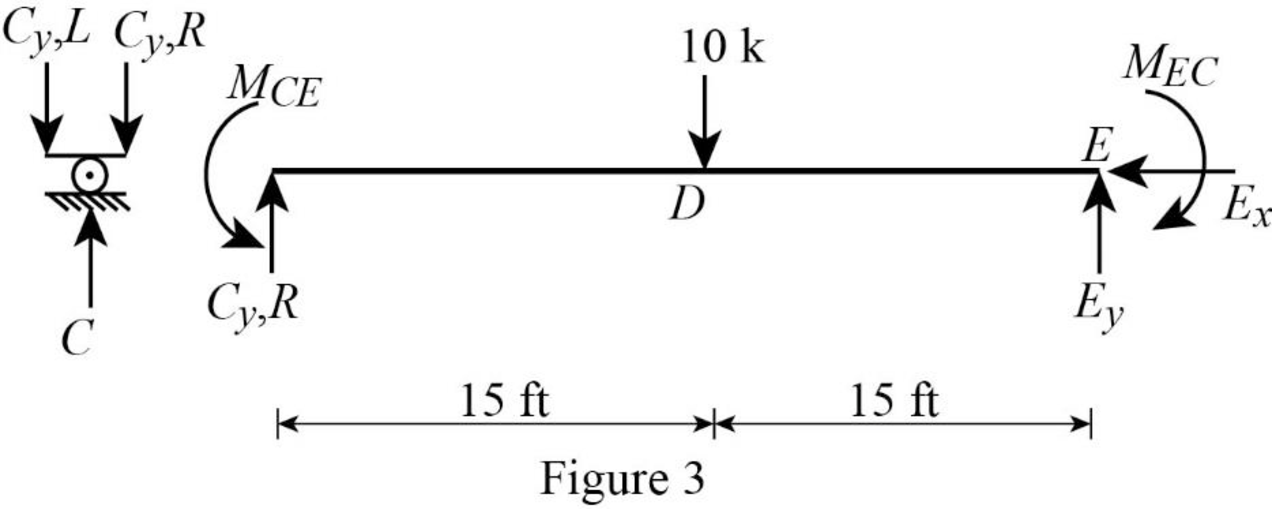
Calculate the vertical reaction at the right end of the joint C by taking moment about point E.
Calculate the horizontal reaction at point E by resolving the horizontal equilibrium.
Calculate the vertical reaction at point E by resolving the vertical equilibrium.
Calculate the total reaction at point C .
Substitute
Show the reaction of the beam in Figure 4.
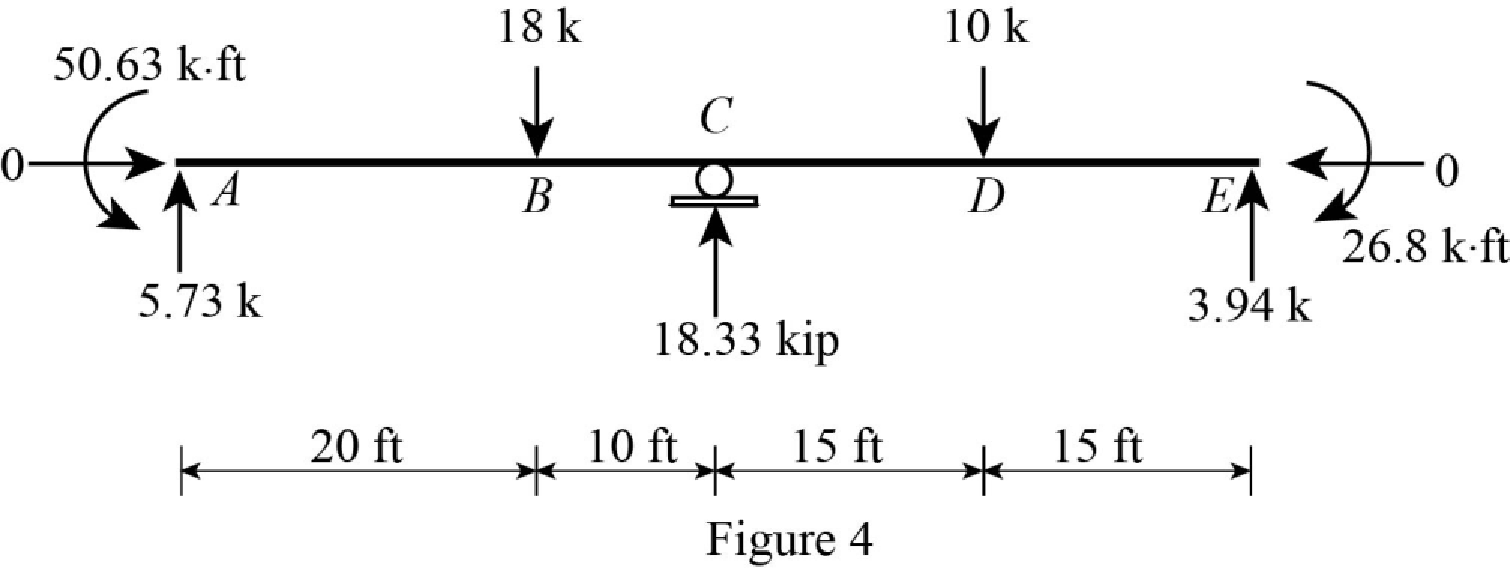
Refer Figure 4,
Shear diagram:
Point A:
Point B:
Point C:
Point D:
Point E:
Plot the shear force diagram of the beam as in Figure 5.
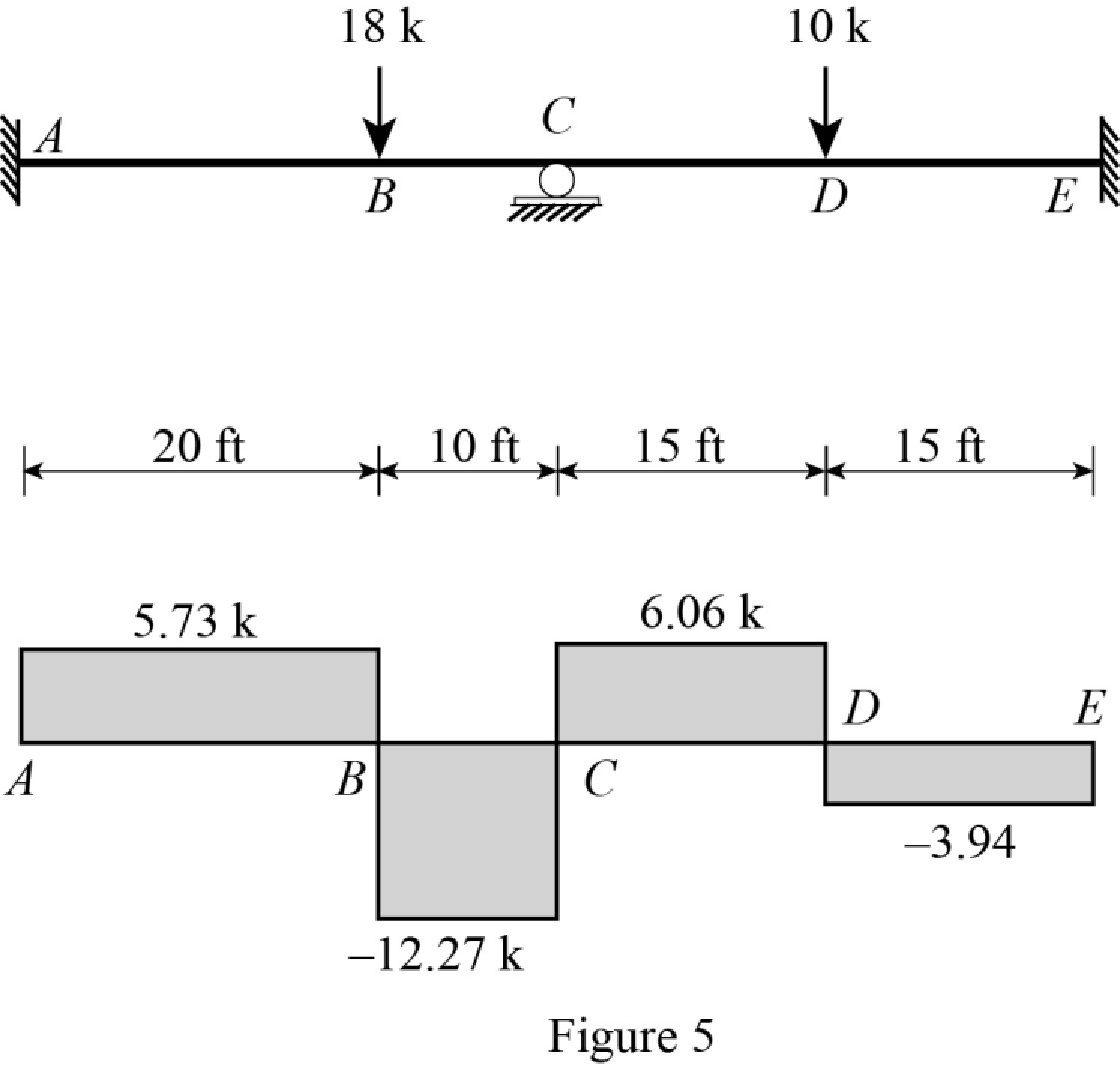
Refer Figure 4,
Bending moment diagram:
Point A:
Point B:
Point C:
Point D:
Point E:
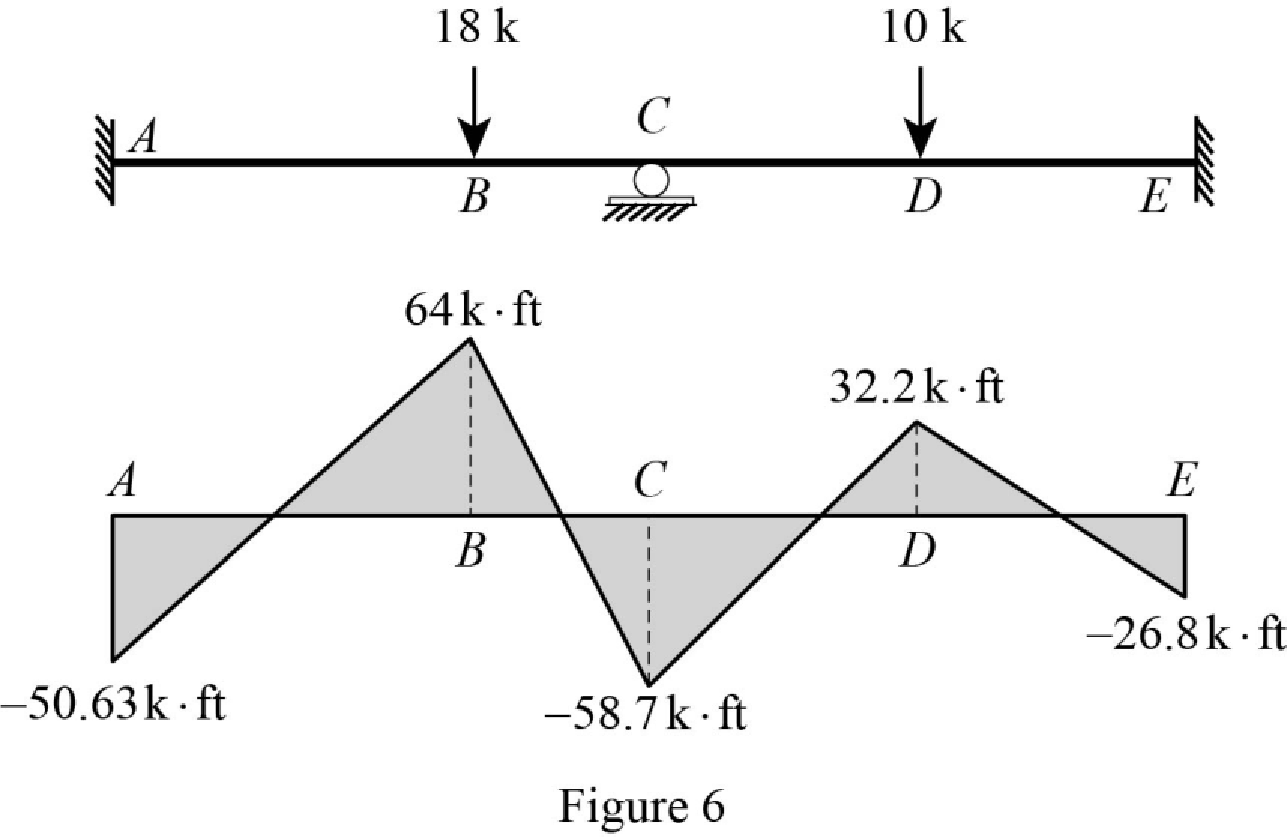
Plot the bending moment diagram of the beam as in Figure 6.
Want to see more full solutions like this?
Chapter 15 Solutions
Structural Analysis, Si Edition


- Handwritten answers only please. Thank you!arrow_forwardAn unstretchable cable with mass per unit length 5 kg/m is hanging between points A and B. The horizontal distance between A and B is 20 m. The vertical distance is 15 m (B is in a lower position). We measure a point on the cable which lies by a horizontal distance of 5 meters to point A. It is found to be 4 meters lower than point A. The shape of the cable is almost straight.Use the small sag approximation (Lecture 5) and keep the accuracy to O (e) to estimate the horizontal load H on A and B.arrow_forwardQ1. For the frame shown below: i. ii. iii. Identify the unknown reactions for the supports (Pin at A and F). Determine if the frame is statically determinate, if not determine the degrees of determinacy. Calculate the unknown reactions for the frames (the frame has internal pin at C) Pin D 25kN 30° 30° 30° 30 B 40kN 60° 16m 60°arrow_forward
- Q2. For the beams shown below: i. ii. iii. iv. Sketch the deflected shape Determine the reactions at the supports Calculate and sketch the distribution of the shear force and the bending moment Locate the max moment and POC locations (Note: all dimensions are in meters) 15kN/m 6kN/m 30 KN 30 A B Pin D 5.0 1.0 2.0 3.0arrow_forwardQ2. For the beams shown below: i. ii. iii. iv. Sketch the deflected shape Determine the reactions at the supports Calculate and sketch the distribution of the shear force and the bending moment Locate the max moment and POC locations (Note: all dimensions are in meters) 15kN/m 6kN/m 30 kN 30 Σ A B Pin C D 5.0 1.0 2.0 3.0arrow_forwardUse Burdine's (1953) equation from the handout (the statistical capillary tube model equation with the values of b, r, and m assumed by Burdine) to mathematically derive a relationship for the hydraulic conductivity function that is based on the SWRC model of Brooks and Corey (1964).arrow_forward
- Question 2 A sluice gate controls flow in open channels. At sections 1 and 2, the flow is uniform and the pressure is hydrostatic. Neglecting bottom friction and atmospheric pressure, calculate the velocities V1 and V2, and the horizontal force, F, required to hold the gate if h1 = 6m, h2 = 1m, and b = 5m. h₁V₁ Sluice gate, width b Farrow_forwardQuestion 1 A pipeline 30 m long connects two tanks which have a difference of water level of 12 m. The first 10 m of pipeline from the upper tank is of 40 mm diameter and the next 20 m is of 60 mm diameter. At the change of section, a valve is fitted. Calculate the rate of flow when the valve is fully opened assuming that its resistance is negligible and that f for both pipes is 0.0054. In order to restrict the flow the valve is then partially closed. If k for the valve is now 5.6, find the percentage reduction in flow. Note the following Reservoir I Segment of Length Pipeline B Diameter (m) (mm) ABC AB 10 40 BC 20 60 Head loss due to friction h₁ = KQ² Valve fl K = 3.028D' Where, •h₂ = k Head loss due to partial closure (VAB-VBC) 2g Reservoir 2 H-12 marrow_forwardCivil engineering students performed an evaluation of the two primary methods of classification (supervised and unsupervised). The evaluation of the two methods utilized the error matrices. Tables 1 and 2 represent supervised and unsupervised methods respectively. Reference Data Bare Agriculture Buildings Forest land Agriculture 130 8 44 48 Classified Data Buildings 12 162 10 16 Forest 0 22 170 38 Bare land 8 14 6 180 Table 1 Results of supervised classification 252 + Reference Data Bare Agriculture Buildings Forest land Agriculture 60 16 44 48 Classified Data Buildings 13 80 22 16 Forest 2 35 120 38 Bare land 8 14 6 180 Table 2 Results of unsupervised classification Compare the two methods based on the following parameters: a. User accuracy b. Producer accuracy c. Overall accuracy. d. Explain the above parameters (a, b & c) e. Which one of the two methods has higher accuracy? Justify your answerarrow_forward
- The following figure shows the cross-section of an anchored sheet pile wall. The soil properties and some wall dimensions are shown in the figure and spacing between anchor rods is 2.0 m (center to center). Design the wall using Rankine theory; i.e., calculate the depth of embedment of the wall (D), tensile force on each rodarrow_forwardQ2: A circular concrete culvert of diameter 120 cm carries water of depth 75 cm to irrigate a 30-hectare field. What could be the discharge of this canal if the slope was 0.002? Use Manning's n= 0.014. TWOarrow_forwardA farm of 40 hectares is supplied by open field drains. The spacing of these drains were selected to be 100m and the length of each drain is 600 m. If the drainage coefficient is 4 cm/day, find: 1- Discharge at the end of a field drain. 2- Total discharge passed through the collector drain. 3- The dimension of open drains, if n= 0.03, S= 0.00035 and Z= 1.5arrow_forward
