Concept explainers
Suppose an (extremely hypothetical) elongated sunspot forms that extends from a latitude of 30° to a latitude of 40° along a fixed of longitude on the Sun. How will the appearance of that sunspot change as the Sun rotates? (Figure 15.17 should help you figure this out.)
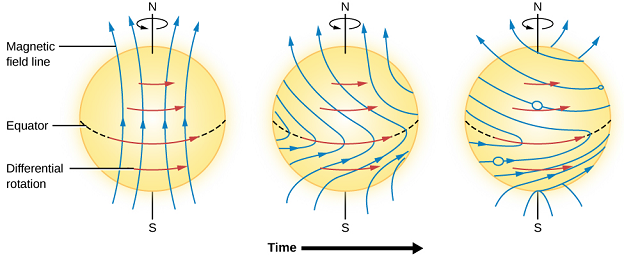
Figure 15.17 Magnetic Field Lines Wind Up. Because the Sun spins faster at the equator than near the poles, the magnetic fields in the Sun tend to wind up as shown, and after a while make loops. This is an idealized diagram; the real situation is much more complex.
Want to see the full answer?
Check out a sample textbook solution
Chapter 15 Solutions
Astronomy
Additional Science Textbook Solutions
Campbell Biology (11th Edition)
Organic Chemistry (8th Edition)
Anatomy & Physiology (6th Edition)
Human Physiology: An Integrated Approach (8th Edition)
Cosmic Perspective Fundamentals
Introductory Chemistry (6th Edition)


- 9. A spring has a force constant of 100 N/m and an unstretched length of 0.07 m. One end is attached to a post that is free to rotate in the center of a smooth. table, as shown in the top view in the figure below. The other end is attached to a 1kg disc moving in uniform circular motion on the table, which stretches the spring by 0.03 m. Friction is negligible. What is the centripetal force on the disc? Top View (a) 0.3 N (b) 3.0 N (c) 10 N (d) 300 N (e) 1000 Narrow_forward4. A child has a ball on the end of a cord, and whirls the ball in a vertical circle. Assuming the speed of the ball is constant (an approximation), when would the tension in the cord be greatest? (a) At the top of the circle. (b) At the bottom of the circle. (c) A little after the bottom of the circle when the ball is climbing. (d) A little before the bottom of the circle when the ball is descending quickly. (e) Nowhere; the cord is pulled the same amount at all points.arrow_forward3. In a rotating vertical cylinder (Rotor-ride) a rider finds herself pressed with her back to the rotating wall. Which is the correct free-body diagram for her? (a) (b) (c) (d) (e)arrow_forward
- 8. A roller coaster rounds the bottom of a circular loop at a nearly constant speed. At this point the net force on the coaster cart is (a) zero. (b) directed upward. (c) directed downward. (d) Cannot tell without knowing the exact speed.arrow_forward5. While driving fast around a sharp right turn, you find yourself pressing against the left car door. What is happening? (a) Centrifugal force is pushing you into the door. (b) The door is exerting a rightward force on you. (c) Both of the above. (d) Neither of the above.arrow_forward7. You are flung sideways when your car travels around a sharp curve because (a) you tend to continue moving in a straight line. (b) there is a centrifugal force acting on you. (c) the car exerts an outward force on you. (d) of gravity.arrow_forward
- 1. A 50-N crate sits on a horizontal floor where the coefficient of static friction between the crate and the floor is 0.50. A 20-N force is applied to the crate acting to the right. What is the resulting static friction force acting on the crate? (a) 20 N to the right. (b) 20 N to the left. (c) 25 N to the right. (d) 25 N to the left. (e) None of the above; the crate starts to move.arrow_forward3. The problem that shall not be named. m A (a) A block of mass m = 1 kg, sits on an incline that has an angle 0. Find the coefficient of static friction by analyzing the system at imminent motion. (hint: static friction will equal the maximum value) (b) A block of mass m = 1kg made of a different material, slides down an incline that has an angle 0 = 45 degrees. If the coefficient of kinetic friction increases is μ = 0.5 what is the acceleration of the block? karrow_forward2. Which of the following point towards the center of the circle in uniform circular motion? (a) Acceleration. (b) Velocity, acceleration, net force. (c) Velocity, acceleration. (d) Velocity, net force. (e) Acceleration, net force.arrow_forward
- Problem 1. (20 pts) The third and fourth stages of a rocket are coastin in space with a velocity of 18 000 km/h when a smal explosive charge between the stages separate them. Immediately after separation the fourth stag has increased its velocity to v4 = 18 060 km/h. Wha is the corresponding velocity v3 of the third stage At separation the third and fourth stages hav masses of 400 and 200 kg, respectively. 3rd stage 4th stagearrow_forwardMany experts giving wrong answer of this question. please attempt when you 100% sure . Otherwise i will give unhelpful.arrow_forwardDetermine the shear and moment diagram for the beam shown in Fig.1. A 2 N/m 10 N 8 N 6 m B 4m Fig.1 40 Nm Steps: 1) Determine the reactions at the fixed support (RA and MA) (illustrated in Fig 1.1) 2) Draw the free body diagram on the first imaginary cut (fig. 1.2), and determine V and M. 3) Draw the free body diagram on the second imaginary cut (fig. 1.3), and determine V and M. 4) Draw the shear and moment diagramarrow_forward
 Foundations of Astronomy (MindTap Course List)PhysicsISBN:9781337399920Author:Michael A. Seeds, Dana BackmanPublisher:Cengage Learning
 Stars and Galaxies (MindTap Course List)PhysicsISBN:9781337399944Author:Michael A. SeedsPublisher:Cengage Learning
 AstronomyPhysicsISBN:9781938168284Author:Andrew Fraknoi; David Morrison; Sidney C. WolffPublisher:OpenStax
 Stars and GalaxiesPhysicsISBN:9781305120785Author:Michael A. Seeds, Dana BackmanPublisher:Cengage Learning
 An Introduction to Physical SciencePhysicsISBN:9781305079137Author:James Shipman, Jerry D. Wilson, Charles A. Higgins, Omar TorresPublisher:Cengage Learning