
Concept explainers
Videos
(a)
Interpretation:
The IR spectrum of the given compound is to be sketched with the X-axis range from
Concept introduction:
IR spectroscopy enables to identify different
One of the greatest advantages of IR spectroscopy is that the frequency of a particular type of vibration is typically found within a characteristic range of frequencies, regardless of the functional group with which the vibration is associated. The fact that absorptions by certain vibrations appear with characteristic frequency ranges enables us to use IR spectroscopy to obtain structural information about a molecule. Stretching vibrations of
Answer to Problem 15.56P
The IR spectrum of the given molecule can be sketched as follows:

Explanation of Solution
The given molecule is
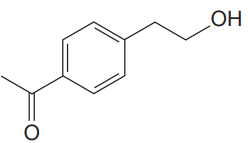
The given molecule has a ketone and alcohol as functional groups. According to Table 15-2, the characteristic frequency of absorption of alcohols
Each significant peak is assigned in the above IR spectrum.
The absorptions by certain vibrations appear with characteristic frequency ranges, enabling us to use IR spectroscopy to obtain structural information about a molecule.
(b)
Interpretation:
The IR spectrum of the given compound is to be sketched with the X-axis range from
Concept introduction:
IR spectroscopy enables to identify different functional groups in the given molecule.
One of the greatest advantages of IR spectroscopy is that the frequency of a particular type of vibration is typically found within a characteristic range of frequencies, regardless of the functional group with which the vibration is associated. The fact that absorptions by certain vibrations appear with characteristic frequency ranges enables us to use IR spectroscopy to obtain structural information about a molecule. Stretching vibrations of
Answer to Problem 15.56P
The IR spectrum of the given molecule can be sketched as follows:

Explanation of Solution
The given molecule is
The given molecule has an
Each significant peak is assigned in the above IR spectrum.
The absorptions by certain vibrations appear with characteristic frequency ranges, enabling us to use IR spectroscopy to obtain structural information about a molecule.
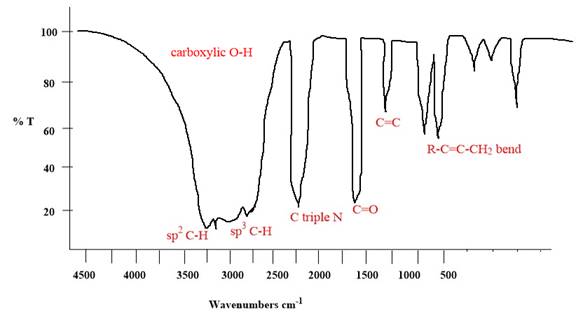
(c)
Interpretation:
The IR spectrum of the given compound is to be sketched with the X-axis range from
Concept introduction:
IR spectroscopy enables to identify different functional groups in the given molecule.
One of the greatest advantages of IR spectroscopy is that the frequency of a particular type of vibration is typically found within a characteristic range of frequencies, regardless of the functional group with which the vibration is associated. The fact that absorptions by certain vibrations appear with characteristic frequency ranges enables us to use IR spectroscopy to obtain structural information about a molecule. Stretching vibrations of
Answer to Problem 15.56P
The IR spectrum of the given molecule can be sketched as follows:
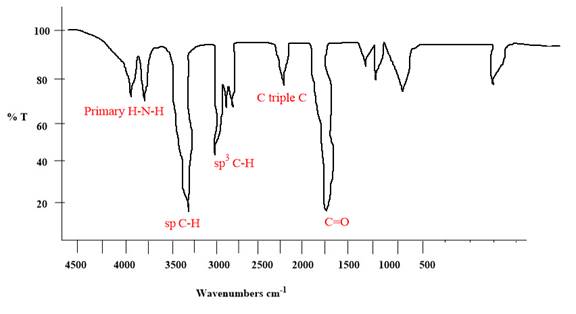
Explanation of Solution
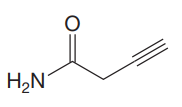
The given molecule is
The given molecule has an alkyne and a primary amide as functional groups. According to Table 15-2, the characteristic frequency of absorption of amides
Each significant peak is assigned in the above IR spectrum.
The absorptions by certain vibrations appear with characteristic frequency ranges, enabling us to use IR spectroscopy to obtain structural information about a molecule.
(d)
Interpretation:
The IR spectrum of the given compound is to be sketched with the X-axis range from
Concept introduction:
IR spectroscopy enables to identify different functional groups in the given molecule.
One of the greatest advantages of IR spectroscopy is that the frequency of a particular type of vibration is typically found within a characteristic range of frequencies, regardless of the functional group with which the vibration is associated. The fact that absorptions by certain vibrations appear with characteristic frequency ranges enables us to use IR spectroscopy to obtain structural information about a molecule. Stretching vibrations of
Answer to Problem 15.56P
The IR spectrum of the given molecule can be sketched as follows:
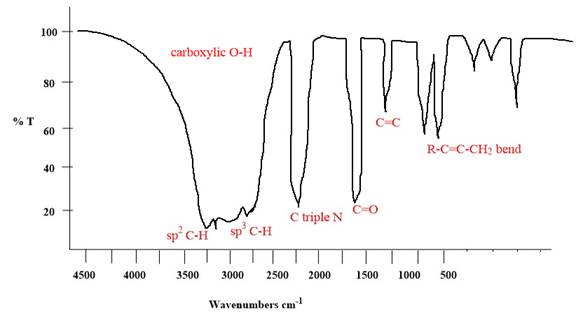
Explanation of Solution
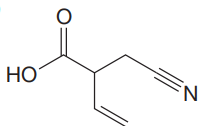
The given molecule is
The given molecule has
According to Table 15-2, the characteristic frequency of absorption of
Each significant peak is assigned in the above IR spectrum.
The absorptions by certain vibrations appear with characteristic frequency ranges, enabling us to use IR spectroscopy to obtain structural information about a molecule.
Want to see more full solutions like this?
Chapter 15 Solutions
EBK ORGANIC CHEMISTRY: PRINCIPLES AND M


- CUE COLUMN NOTES (A. Determine Stereoisomers it has ⑤ Identify any meso B compounds cl Br cl -c-c-c-c-¿- 1 CI C- | 2,4-Dichloro-3-bromopentanearrow_forwardThe acid-base chemistry of both EDTA and EBT are important to ensuring that the reactions proceed as desired, thus the pH is controlled using a buffer. What percent of the EBT indicator will be in the desired HIn2- state at pH = 10.5. pKa1 = 6.2 and pKa2 = 11.6 of EBTarrow_forwardWhat does the phrase 'fit for purpose' mean in relation to analytical chemistry? Please provide examples too.arrow_forward
- For each of the substituted benzene molecules below, determine the inductive and resonance effects the substituent will have on the benzene ring, as well as the overall electron-density of the ring compared to unsubstituted benzene. Molecule Inductive Effects Resonance Effects Overall Electron-Density × NO2 ○ donating O donating O withdrawing O withdrawing O electron-rich electron-deficient no inductive effects O no resonance effects O similar to benzene E [ CI O donating withdrawing O no inductive effects Explanation Check ○ donating withdrawing no resonance effects electron-rich electron-deficient O similar to benzene © 2025 McGraw Hill LLC. All Rights Reserved. Terms of Use | Privacy Center Accesarrow_forwardUnderstanding how substituents activate Rank each of the following substituted benzene molecules in order of which will react fastest (1) to slowest (4) by electrophilic aromatic substitution. Explanation HN NH2 Check X (Choose one) (Choose one) (Choose one) (Choose one) © 2025 McGraw Hill LLC. All Rights Reserved. Terms of Use | Privacy Center Aarrow_forwardIdentifying electron-donating and electron-withdrawing effects on benzene For each of the substituted benzene molecules below, determine the inductive and resonance effects the substituent will have on the benzene ring, as well as the overall electron-density of the ring compared to unsubstituted benzene. Inductive Effects Resonance Effects Overall Electron-Density Molecule CF3 O donating O donating O withdrawing O withdrawing O no inductive effects O no resonance effects electron-rich electron-deficient O similar to benzene CH3 O donating O withdrawing O no inductive effects O donating O withdrawing Ono resonance effects O electron-rich O electron-deficient O similar to benzene Explanation Check Х © 2025 McGraw Hill LLC. All Rights Reserved. Terms of Use | Privacy Centerarrow_forward
- * Hint: Think back to Chem 1 solubility rules. Follow Up Questions for Part B 12. What impact do the following disturbances to a system at equilibrium have on k, the rate constant for the forward reaction? Explain. (4 pts) a) Changing the concentration of a reactant or product. (2 pts) b) Changing the temperature of an exothermic reaction. (2 pts) ofarrow_forwardDraw TWO general chemical equation to prepare Symmetrical and non-Symmetrical ethers Draw 1 chemical reaction of an etherarrow_forwardPlease help me with the following questions for chemistry.arrow_forward
 Organic Chemistry: A Guided InquiryChemistryISBN:9780618974122Author:Andrei StraumanisPublisher:Cengage Learning