Concept explainers
Videos
Interpretation: The line in the given Figure that best represents the dependence of the degree of ionization of acetic acid on its concentration in aqueous solution is to be stated.
Concept introduction: Degree of ionization is defined as the ratio of the number of molecules ionized in an aqueous medium to the total number of molecules dissolve in the aqueous medium. The measure of concentration of ions in a solution gives the ionic strength of the solution.
To determine: The line in the given Figure that best represents the dependence of the degree of ionization of acetic acid on its concentration in aqueous solution.
Answer to Problem 15.1VP
Solution
The red line best represents the nature of acetic acid.
Explanation of Solution
Explanation
The given figure is,
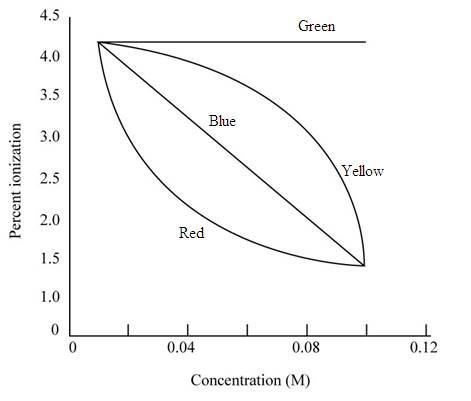
Figure 1
The given acid is acetic acid which is a weak acid. The degree of ionization is inversely proportional to the square root of molar concentration according to Ostwald’s dilution law.
In the given graph, the green line shows that there is no effect of concentration on the degree of ionization. Therefore, it is not applicable for an acetic acid. The yellow line shows a tremendous change in the degree of ionization by the change in concentration, this does not happen for a weak acid like an acetic acid.
Therefore, it does not represent acetic acid. The blue line represents the change in degree of ionization by the change in concentration in a continuous manner. In a weak acid, the change in degree of ionization is not continuous. Thus, it also does not represent acetic acid. The red line shows that the degree of ionization increases with the decrease in concentration of an acid.
Thus, the red curve represents the degree of ionization for the acetic acid.
Hence, in all the lines shown in Figure 1, red line best represents the nature of acetic acid.
Conclusion
The red line best represents the dependence of the degree of ionization of acetic acid on its concentration in aqueous solution.
Want to see more full solutions like this?
Chapter 15 Solutions
Chemistry: The Science in Context (Fifth Edition)


- Show the mechanism steps to obtain the lowerenergy intermediate: *see imagearrow_forwardSoap is made by the previous reaction *see image. The main difference between one soap and another soap isthe length (number of carbons) of the carboxylic acid. However, if a soap irritates your skin, they mostlikely used too much lye.Detergents have the same chemical structure as soaps except for the functional group. Detergentshave sulfate (R-SO4H) and phosphate (R-PO4H2) functional groups. Draw the above carboxylic acidcarbon chain but as the two variants of detergents. *see imagearrow_forwardWhat are the reactions or reagents used? *see imagearrow_forward
- The two pKa values of oxalic acid are 1.25 and 3.81. Why are they not the same value? Show the protontransfer as part of your explanation. *see imagearrow_forwardасть Identify all the bonds that gauche interact with C-OMe in the most stable conformation of the above compound.arrow_forwardPredict the reactants used in the formation of the following compounds using Acid-Catalyzed dehydration reactionarrow_forward
- Can I please get help with this?arrow_forward.. Give the major organic product(s) for each of the following reactions or sequences of reactions. Show ll relevant stereochemistry [3 ONLY]. A H Br 1. NaCN 2 NaOH, H₂O, heat 3. H3O+ B. CH₂COOH 19000 1. LiAlH4 THF, heat 2 H₂O* C. CH Br 1. NaCN, acetone 2 H3O+, heat D. Br 1. Mg. ether 3. H₂O+ 2 CO₂ E. CN 1. (CH) CHMgBr, ether 2 H₂O+arrow_forwardAssign this COSY spectrumarrow_forward
 ChemistryChemistryISBN:9781305957404Author:Steven S. Zumdahl, Susan A. Zumdahl, Donald J. DeCostePublisher:Cengage Learning
 ChemistryChemistryISBN:9781259911156Author:Raymond Chang Dr., Jason Overby ProfessorPublisher:McGraw-Hill Education
 Principles of Instrumental AnalysisChemistryISBN:9781305577213Author:Douglas A. Skoog, F. James Holler, Stanley R. CrouchPublisher:Cengage Learning
 Organic ChemistryChemistryISBN:9780078021558Author:Janice Gorzynski Smith Dr.Publisher:McGraw-Hill Education
 Chemistry: Principles and ReactionsChemistryISBN:9781305079373Author:William L. Masterton, Cecile N. HurleyPublisher:Cengage Learning
 Elementary Principles of Chemical Processes, Bind...ChemistryISBN:9781118431221Author:Richard M. Felder, Ronald W. Rousseau, Lisa G. BullardPublisher:WILEY