
Concept explainers
Draw the plot for
Explanation of Solution
Given information:
The specific gravity of the loessial soil is
The liquid limit of the soil is
The dry density of the soil is
Calculation:
Refer to the Equation (11.5) in the textbook.
Consider the density of water is
Consider the liquid limit of 10.
Find the natural dry unit weight
Substitute
Tabulate the remaining calculated values as in Table 1.
| LL | |
| 10 | 133.434 |
| 15 | 120.545 |
| 20 | 109.927 |
| 25 | 101.029 |
| 30 | 93.4626 |
| 35 | 86.9508 |
| 40 | 81.2874 |
Table 1
Draw the graph between liquid limit versus the natural dry unit weight as in Figure 1.
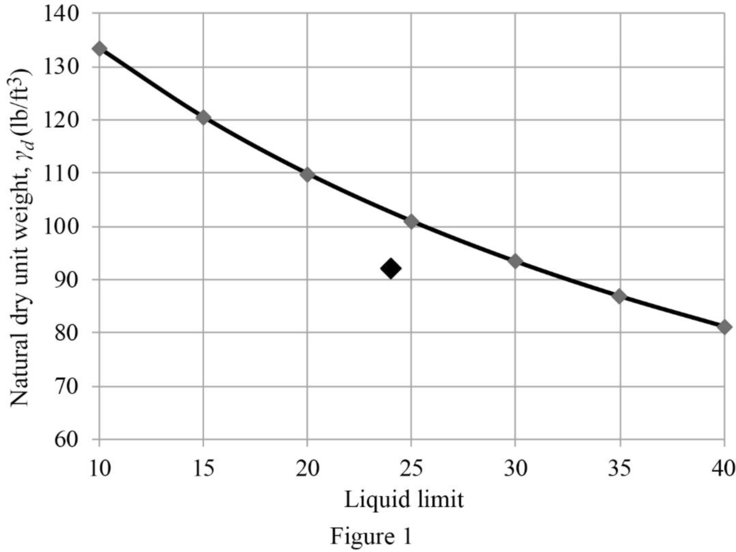
Mark the liquid limit of 24 corresponding to the dry unit weight of
Thus, collapse will occur.
Want to see more full solutions like this?
Chapter 15 Solutions
MindTap Engineering, 1 term (6 months) Printed Access Card for Das/Sivakugan’s Principles of Foundation Engineering, 9th


- 1. Plot the SWRC (suction vs. volumetric water content) from the van Genuchten (1980) model for the following “base-case” parameters (assume m = 1-1/nvG): alpha vG = 0.35 kPa-1, nvG = 2.2,Delta res = 0.02, and delta S = delta sat = 0.45. These values are approximately representative of a sand.Perform a sensitivity analysis on each of the base case parameters (i.e., vary each by ±10% while holding the other three constant) to determine their relative effects on the SWRC. For example, how would a change in s alter the curve if the other base case parameters stay the same? In your answer, provide 4 plots for the parametric evaluation of each parameter as well as a brief qualitative explanation for each plot (for example, when investigating the effect of alpha vG, show the base-case curve and the curves with different values of alpha vG on the same plot). Be sure that suction is plotted on a logarithmic scale. Also, discuss how theparameters of the van Genuchten SWRC model might differ…arrow_forwardUsing AutoCAD and exact measure that numberarrow_forwardA fully grouted reinforced masonry wall is to be constructed of 8-in. CMU. The wall height is 18feet. It is assumed to be simply supported. The wall is to be designed for an out-of-plane seismicload of 52 lbs./ft.2, which can act in either direction. The wall also supports a roof dead load of600 lbs./ft. and a roof live load of 300 lbs./ft. along the wall length. The roof loads have aneccentricity of 2.5 inches. Since there is seismic load, load combinations (6) and (7) in Chapter 2of ASCE 7-22 should be considered. In these two load combinations,horizontal seismic loadhE =andvertical seismic loadvE = . You may ignorevE in this problem for simplicity. The masonryhas a specified compressive strength of 2,500 psi. (a) Use the strength design provisions of TMS402 to determine the size and spacing of the vertical bars needed. Use the P-δ analysis method inSection 9.3.4.4.2 of TMS 402 to determine Mu. (b) Repeat the design using the momentmagnification method in Section 9.3.4.4.3 instead.…arrow_forward
- The city's downtown area on Elm St, with its intricate network of roads and intersections, has long been a challenge for both seasoned travelers and newcomers alike. Given the lane configurations for the shown intersection, find the number of conflict points. Vehicle-to-vehicle conflicts (merge, diverge, and/or crossing conflicts) Vehicle-to-pedestrian conflicts Vehicle-to-bicycle conflictsarrow_forwardCan you please do hand calcs and breakdown each steparrow_forwardQ4. Statically determinate or indeterminate frame analysis by the stiffness method a) Determine the stiffness matrix of the frame as shown in Fig. 4. Nodes 1 and 3 are fixed supports. Assume I = 300(10%) mm, A = 10(103) mm², E = 200 GPa for each member. Indicate the degrees-of freedom in all the stiffness matrices. Use the values of L3-3.5 m, w = 24 kN/m and P = 30 kN. Note, L4-1.8L3 (i.e. 1.8 times L3). b) Determine all the displacement components at node 2 and all internal reactions at node 2. Show all calculations. c) Draw the BMD of the frame on the compression side showing all the salient values. Show all calculations. d) Repeat the problem using the Strand 7. Show the model with all the nodes and element numbers and boundary conditions. Submit a hard copy from Strand7 showing all the reactions (highlight these in the hard copy). Display the bending moment diagram for the frame. 4 e) Compare the BMD from Strand 7 with the theoretical one and compare the respective values of…arrow_forward
- Can you please break down all the hand calcs and make sure we answer the below. a Determine the global stiffness matrices (k’) of all truss members including correct degrees-of freedom (dof)-3x3 b Determine the global stiffness matrix (K) of the whole truss (include dof numbers) c i) Calculate vectors D and Q (4+4). ii) Show partition and solve KD=Q iii) Calculate all the member forces d i) Solve the problem using Strand7 (model) (You must model the beam property as truss) ii) Display of deflected shape, nodal displacements and member forces (3+3+3) e Comparison of member forces and comments , comparison of displacemnts and commnetsarrow_forwardYOU HAVE A UNIFORM SUBGRADE ELEVATION FOR YOUR BUILDING FOUNDATION THAT HASBEEN VERIFIED. YOUR SLAB IS DESIGNED TO BE 12 INCHES THICK.USING THE GIVENDIMENSIONS AROUND THE PROPOSED BUILDING FOUNDATION, CALCULATE THE CUBIC FEETAND THE CUBIC YARDS OF CONCRETE NEEDED FOR THE FOUNDATION **Sketch Attached**arrow_forwardWHAT ARE THE COORDINATES (N,E) AT POINT A AND POINT B IN THE SKETCH (ATTACHED)arrow_forward
- Can you please do with hand calcs and answer the following: a Determine the global stiffness matrix (K) of the beam including indicating correct degrees-of freedom (dof) b i) Calculate vectors D and Q ii) Show partition and solve KD=Q for D iii) Calculate all reactions c BMD & max BM, deflected shape d i) Solve the problem using Strand7 (model) ii) Display the deflected shape and BMD e Comparisons of reactions + Max BM including commentsarrow_forward5-1. Determine the force in each member of the truss, and state if the members are in tension or compression.arrow_forwardI have the correct answer provided, just lookng for a more detailed breadown of how the answer was obtained thanks.arrow_forward
 Fundamentals of Geotechnical Engineering (MindTap...Civil EngineeringISBN:9781305635180Author:Braja M. Das, Nagaratnam SivakuganPublisher:Cengage Learning
 Principles of Foundation Engineering (MindTap Cou...Civil EngineeringISBN:9781305081550Author:Braja M. DasPublisher:Cengage Learning
 Principles of Geotechnical Engineering (MindTap C...Civil EngineeringISBN:9781305970939Author:Braja M. Das, Khaled SobhanPublisher:Cengage Learning
 Principles of Foundation Engineering (MindTap Cou...Civil EngineeringISBN:9781337705028Author:Braja M. Das, Nagaratnam SivakuganPublisher:Cengage Learning