
Concept explainers
Videos
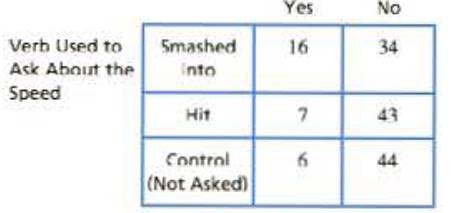
In a classic study, Loftus and Palmer (1974) investigated the relationship between memory for eyewitnesses and the questions they are asked. In the study, participants watched a film of an automobile accident and then were questioned about the accident. One group was asked how fast the cars were going when they "smashed into" each other. A second group was asked about the speed when the ears "hit" each other and a third group was not asked any question about the speed of the ears. A week later, the participants returned to answer additional questions about the accident, including whether they recalled seeing any broken glass. Although there was no broken glass in the film, several students claimed to remember seeing it. The following table shows the Frequency distribution of responses for each group.
- a. Does the proportion of participants who claim to remember broken glass differ significantly from group to group? Test with or α = .05
- b. Compute Cramér's V to measure the size of the treatment effect.
- c. Describe how the phrasing of the question influenced the participants' memories.
- d. Write a sentence demonstrating how the outcome of the hypothesis lest and the measure of effect size would be reported in a journal article
a.
To check: Whether the proportions of participants who claim to remember broken glass differ significantly from group to group for the given question.
Answer to Problem 13P
Explanation of Solution
Given info:
A sample of 150 students were involved in a study based on “the response they gave regarding the broken glass or verb used for speed”. The distribution is given in the question. Use
Calculations:
Step 1: Null Hypothesis and Alternate Hypothesis are:
Step 2: For the given sample, degrees of freedom equals:
With
Step 3:
The formula to calculate expected frequency is:
Substitute
For the category “smashed into”, the expected frequencies are:
For the category “Hit”, the expected frequencies are:
Similarly, for the category “control”, the expected frequencies are:
The observed and expected frequency is given below:
| Yes | No | Total | |
| Smashed into | 16 (9.66) | 34 (40.33) | 50 |
| Hit | 7 (9.66) | 43 (40.33) | 50 |
| Control (not asked) | 6 (9.66) | 44 (40.33) | 50 |
| Total | 29 | 121 | 150 |
Here the values within the braces are the expected frequencies.
Finally substitute the values in the
Step 4: Rejection rule:
Reject
Since
Step 5: Conclusion
Reject the null hypothesis and conclude that proportion of participants who claim to remember broken glass differ significantly from group to group.
b.
To find: The value of Cramer’s V to measure the size of the treatment effect.
Answer to Problem 13P
Explanation of Solution
Calculations:
The formula for Cramer’s V is:
Here,
Substitute 7.77 for
Hence, value of Cramer’s V is 0.227
c.
To describe: How does the phrasing of the question influence the participant’s memories.
Answer to Problem 13P
Explanation of Solution
Cramer’s V is used as post-test to determine strengths of association once the chi-square has determined significance. A value of 0.227 indicates a small effect. That is, a little association between the groups.
d.
Answer to Problem 13P
Explanation of Solution
The result showed that the proportion of participants who claim to remember broken glass differ significantly from group to group.
Want to see more full solutions like this?
Chapter 15 Solutions
Essentials Of Statistics For The Behavioral Sciences


- Suppose that the chance that an elementary student eats hot lunch is 30 percent. What’s the chance that, among 20 randomly selected students, between 6 and 8 students eat hot lunch (inclusive)?arrow_forwardBob’s commuting times to work are varied. He makes it to work on time 80 percent of the time. On 12 randomly selected trips to work, what’s the chance that Bob makes it on time at least 10 times?arrow_forwardYour chance of winning a small prize in a scratch-off ticket is 10 percent. You buy five tickets. What’s the chance you will win at least one prize?arrow_forward
- Suppose that 60 percent of families own a pet. You randomly sample four families. What is the chance that two or three of them own a pet?arrow_forwardIf 40 percent of university students purchase their textbooks online, in a random sample of five students, what’s the chance that exactly one of them purchased their textbooks online?arrow_forwardA stoplight is green 40 percent of the time. If you stop at this light eight random times, what is the chance that it’s green exactly five times?arrow_forward
- If 10 percent of the parts made by a certain company are defective and have to be remade, what is the chance that a random sample of four parts has one that is defective?arrow_forwardQuestion 4 Fourteen individuals were given a complex puzzle to complete. The times in seconds was recorded for their first and second attempts and the results provided below: 1 2 3 first attempt 172 255 second attempt 70 4 5 114 248 218 194 270 267 66 6 7 230 219 341 174 8 10 9 210 261 347 218 200 281 199 308 268 243 236 300 11 12 13 14 140 302 a. Calculate a 95% confidence interval for the mean time taken by each individual to complete the (i) first attempt and (ii) second attempt. [la] b. Test the hypothesis that the difference between the two mean times for both is 100 seconds. Use the 5% level of significance. c. Subsequently, it was learnt that the times for the second attempt were incorrecly recorded and that each of the values is 50 seconds too large. What, if any, difference does this make to the results of the test done in part (b)? Show all steps for the hypothesis testarrow_forwardQuestion 3 3200 students were asked about the importance of study groups in successfully completing their courses. They were asked to provide their current majors as well as their opinion. The results are given below: Major Opinion Psychology Sociology Economics Statistics Accounting Total Agree 144 183 201 271 251 1050 Disagree 230 233 254 227 218 1162 Impartial 201 181 196 234 176 988 Total 575 597 651 732 645 3200 a. State both the null and alternative hypotheses. b. Provide the decision rule for making this decision. Use an alpha level of 5%. c. Show all of the work necessary to calculate the appropriate statistic. | d. What conclusion are you allowed to draw? c. Would your conclusion change at the 10% level of significance? f. Confirm test results in part (c) using JASP. Note: All JASP input files and output tables should be providedarrow_forward
- Question 1 A tech company has acknowledged the importance of having records of all meetings conducted. The meetings are very fast paced and requires equipment that is able to capture the information in the shortest possible time. There are two options, using a typewriter or a word processor. Fifteen administrative assistants are selected and the amount of typing time in hours was recorded. The results are given below: 1 2 3 4 5 6 7 8 9 10 11 12 13 14 15 typewriter 8.0 6.5 5.0 6.7 7.8 8.5 7.2 5.7 9.2 5.7 6.5 word processor 7.2 5.7 8.3 7.5 9.2 7.2 6.5 7.0 6.9 34 7.0 6.9 8.8 6.7 8.8 9.4 8.6 5.5 7.2 8.4 a. Test the hypothesis that the mean typing time in hours for typewriters is less than 7.0. Use the 1% level of significance. b. Construct a 90% confidence interval for the difference in mean typing time in hours, where a difference is equal to the typing time in hours of word processors minus typing time in hours of typewriter. c. Using the 5% significance level, determine whether there is…arrow_forwardIllustrate 2/7×4/5 using a rectangular region. Explain your work. arrow_forwardWrite three other different proportions equivalent to the following using the same values as in the given proportion 3 foot over 1 yard equals X feet over 5 yardsarrow_forward
 Big Ideas Math A Bridge To Success Algebra 1: Stu...AlgebraISBN:9781680331141Author:HOUGHTON MIFFLIN HARCOURTPublisher:Houghton Mifflin Harcourt
 Glencoe Algebra 1, Student Edition, 9780079039897...AlgebraISBN:9780079039897Author:CarterPublisher:McGraw Hill
 Holt Mcdougal Larson Pre-algebra: Student Edition...AlgebraISBN:9780547587776Author:HOLT MCDOUGALPublisher:HOLT MCDOUGAL
 Functions and Change: A Modeling Approach to Coll...AlgebraISBN:9781337111348Author:Bruce Crauder, Benny Evans, Alan NoellPublisher:Cengage Learning