Throwing events in track and field include the shot put, the discus throw, the hammer throw, and the javelin throw. The distance that an athlete can achieve depends on the initial velocity of the object thrown and the angle above the horizontal at which the object leaves the hand. In Exercises of 37-138, an athlete whose event h the shot put releases the shot with the same initial velocity, but at different angles. When the shot is released at an angle of 35 o , its path can be modeled by the formula y = − 0.01 x 2 + 0.7 x + 6.1 in which x is The shot's horizontal distance, in feet, and y is its height, in feet. This formula is shown by one of the graphs, (a) or (b), in the figure. Use the formula to determine the shot's maximum distance. Use a calculator and round to the nearer tenth of a foot. Which graph, (a) or (b), shows the shot's path?
Throwing events in track and field include the shot put, the discus throw, the hammer throw, and the javelin throw. The distance that an athlete can achieve depends on the initial velocity of the object thrown and the angle above the horizontal at which the object leaves the hand. In Exercises of 37-138, an athlete whose event h the shot put releases the shot with the same initial velocity, but at different angles. When the shot is released at an angle of 35 o , its path can be modeled by the formula y = − 0.01 x 2 + 0.7 x + 6.1 in which x is The shot's horizontal distance, in feet, and y is its height, in feet. This formula is shown by one of the graphs, (a) or (b), in the figure. Use the formula to determine the shot's maximum distance. Use a calculator and round to the nearer tenth of a foot. Which graph, (a) or (b), shows the shot's path?
Solution Summary: The author explains how to determine which graph shows the shortest path using the function y=-0.01x2+0.7x+6.1.
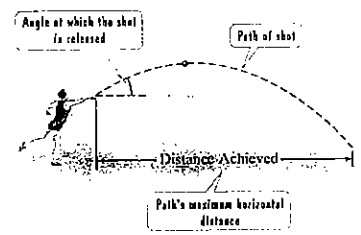
Throwing events in track and field include the shot put, the discus throw, the hammer throw, and the javelin throw. The distance that an athlete can achieve depends on the initial velocity of the object thrown and the angle above the horizontal at which the object leaves the hand.
In Exercises of 37-138, an athlete whose event h the shot put releases the shot with the same initial velocity, but at different angles.
When the shot is released at an angle of 35o, its path can be modeled by the formula
y
=
−
0.01
x
2
+
0.7
x
+
6.1
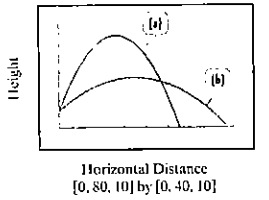
in which x is The shot's horizontal distance, in feet, and y is its height, in feet. This formula is shown by one of the graphs, (a) or (b), in the figure. Use the formula to determine the shot's maximum distance. Use a calculator and round to the nearer tenth of a foot. Which graph, (a) or (b), shows the shot's path?
Practice
k Help
ises
A
96
Anewer The probability that you get a sum of at least 10 is
Determine the number of ways that the specified event can occur when
two number cubes are rolled.
1. Getting a sum of 9 or 10
3. Getting a sum less than 5
2. Getting a sum of 6 or 7
4. Getting a sum that is odd
Tell whether you would use the addition principle or the multiplication
principle to determine the total number of possible outcomes for the
situation described.
5. Rolling three number cubes
6. Getting a sum of 10 or 12 after rolling three number cubes
A set of playing cards contains four groups of cards designated by color
(black, red, yellow, and green) with cards numbered from 1 to 14 in each
group. Determine the number of ways that the specified event can occur
when a card is drawn from the set.
7. Drawing a 13 or 14
9. Drawing a number less than 4
8. Drawing a yellow or green card
10. Drawing a black, red, or green car
The spinner is divided into equal parts.
Find the specified…
Answer the questions
How can I prepare for me Unit 3 test in algebra 1? I am in 9th grade.
Need a deep-dive on the concept behind this application? Look no further. Learn more about this topic, algebra and related others by exploring similar questions and additional content below.


 Holt Mcdougal Larson Pre-algebra: Student Edition...AlgebraISBN:9780547587776Author:HOLT MCDOUGALPublisher:HOLT MCDOUGAL
 Algebra & Trigonometry with Analytic GeometryAlgebraISBN:9781133382119Author:SwokowskiPublisher:Cengage
 Trigonometry (MindTap Course List)TrigonometryISBN:9781337278461Author:Ron LarsonPublisher:Cengage Learning
 Elementary Geometry For College Students, 7eGeometryISBN:9781337614085Author:Alexander, Daniel C.; Koeberlein, Geralyn M.Publisher:Cengage,
 Elementary AlgebraAlgebraISBN:9780998625713Author:Lynn Marecek, MaryAnne Anthony-SmithPublisher:OpenStax - Rice University
 Algebra: Structure And Method, Book 1AlgebraISBN:9780395977224Author:Richard G. Brown, Mary P. Dolciani, Robert H. Sorgenfrey, William L. ColePublisher:McDougal Littell