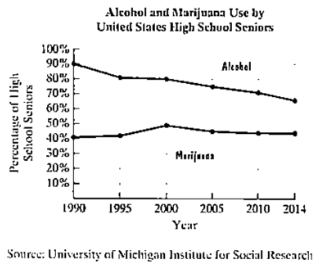
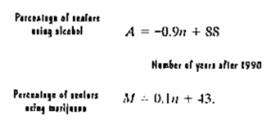
Application Exercises The graphs show the percentage of high school seniors who had ever used alcohol or marijuana. The data can be described by the following mathematical models: Using this information to solve Exercises 55-56. a. Use the appropriate line graph to estimate the percentage of seniors who used alcohol in 2014. b. Use the appropriate formula to determine the percentage of seniors who used alcohol in 2014. How does this compare with your estimate in part (a)? c. Use the appropriate line graph to estimate the percentage of seniors who used marijuana in 2014. d. Use the appropriate formula to determine the percentage of seniors who used marijuana in 2014. How does this compare with your estimate in part (c)? e. For the period from 1990 through 2014, in which year was alcohol use by seniors at a maximum? Estimate the percentage of seniors who used marijuana in that year.
Application Exercises The graphs show the percentage of high school seniors who had ever used alcohol or marijuana. The data can be described by the following mathematical models: Using this information to solve Exercises 55-56. a. Use the appropriate line graph to estimate the percentage of seniors who used alcohol in 2014. b. Use the appropriate formula to determine the percentage of seniors who used alcohol in 2014. How does this compare with your estimate in part (a)? c. Use the appropriate line graph to estimate the percentage of seniors who used marijuana in 2014. d. Use the appropriate formula to determine the percentage of seniors who used marijuana in 2014. How does this compare with your estimate in part (c)? e. For the period from 1990 through 2014, in which year was alcohol use by seniors at a maximum? Estimate the percentage of seniors who used marijuana in that year.
Solution Summary: The objective here is to determine the percentage of seniors who used alcohol in year 2014 by using the appropriate line graph.
The graphs show the percentage of high school seniors who had ever used alcohol or marijuana.
The data can be described by the following mathematical models:
Using this information to solve Exercises 55-56.
a. Use the appropriate line graph to estimate the percentage of seniors who used alcohol in 2014.
b. Use the appropriate formula to determine the percentage of seniors who used alcohol in 2014. How does this compare with your estimate in part (a)?
c. Use the appropriate line graph to estimate the percentage of seniors who used marijuana in 2014.
d. Use the appropriate formula to determine the percentage of seniors who used marijuana in 2014. How does this compare with your estimate in part (c)?
e. For the period from 1990 through 2014, in which year was alcohol use by seniors at a maximum? Estimate the percentage of seniors who used marijuana in that year.
eric
pez
Xte
in
z=
Therefore, we have
(x, y, z)=(3.0000,
83.6.1 Exercise
Gauss-Seidel iteration with
Start with (x, y, z) = (0, 0, 0). Use the convergent Jacobi i
Tol=10 to solve the following systems:
1.
5x-y+z = 10
2x-8y-z=11
-x+y+4z=3
iteration (x
Assi 2
Assi 3.
4.
x-5y-z=-8
4x-y- z=13
2x - y-6z=-2
4x y + z = 7
4x-8y + z = -21
-2x+ y +5z = 15
4x + y - z=13
2x - y-6z=-2
x-5y- z=-8
realme Shot on realme C30
2025.01.31 22:35
f
Use Pascal's triangle to expand the binomial
(6m+2)^2
Listen
A falling object travels a distance given by the formula d = 6t + 9t2 where d is in feet
and t is the time in seconds. How many seconds will it take for the object to travel
112 feet? Round answer to 2 decimal places. (Write the number, not the units).
Your Answer:
Need a deep-dive on the concept behind this application? Look no further. Learn more about this topic, algebra and related others by exploring similar questions and additional content below.


 Glencoe Algebra 1, Student Edition, 9780079039897...AlgebraISBN:9780079039897Author:CarterPublisher:McGraw Hill
 Holt Mcdougal Larson Pre-algebra: Student Edition...AlgebraISBN:9780547587776Author:HOLT MCDOUGALPublisher:HOLT MCDOUGAL
 Trigonometry (MindTap Course List)TrigonometryISBN:9781337278461Author:Ron LarsonPublisher:Cengage Learning
 Big Ideas Math A Bridge To Success Algebra 1: Stu...AlgebraISBN:9781680331141Author:HOUGHTON MIFFLIN HARCOURTPublisher:Houghton Mifflin Harcourt
 Algebra: Structure And Method, Book 1AlgebraISBN:9780395977224Author:Richard G. Brown, Mary P. Dolciani, Robert H. Sorgenfrey, William L. ColePublisher:McDougal Littell