
Modern Business Statistics with Microsoft Excel (MindTap Course List)
5th Edition
ISBN: 9781285433301
Author: David R. Anderson, Dennis J. Sweeney, Thomas A. Williams
Publisher: Cengage Learning
expand_more
expand_more
format_list_bulleted
Concept explainers
Videos
Textbook Question
Chapter 14.9, Problem 50E
Consider the following data for two variables, x and y.
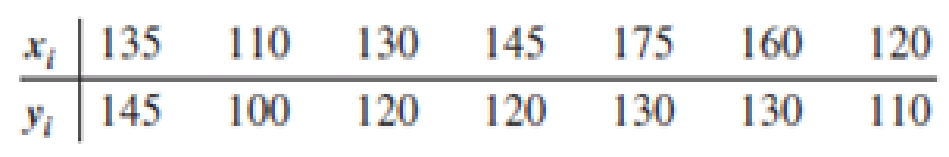
- a. Compute the standardized residuals for these data. Do the data include any outliers? Explain.
- b. Plot the standardized residuals against
- c. Develop a
scatter diagram for these data. Does the scatter diagram indicate any outliers in the data? In general, what implications does this finding have for simple linear regression?
Expert Solution & Answer
Want to see the full answer?
Check out a sample textbook solution
Students have asked these similar questions
310015
K
Question 9,
5.2.28-T
Part 1 of 4
HW Score:
85.96%, 49 of
57 points
Points: 1
Save
of 6
Based on a poll, among adults who regret getting tattoos, 28%
say that they were too young when they got their tattoos.
Assume that six adults who regret getting tattoos are
randomly selected, and find the indicated probability. Complete
parts (a) through (d) below.
a. Find the probability that none of the selected adults say that
they were too young to get tattoos.
0.0520 (Round to four decimal places as needed.)
Clear all
Final check
Feb 7 12:47 US O
how could the bar graph have been organized differently to make it easier to compare opinion changes within political parties
Draw a picture of a normal distribution with
mean 70 and standard deviation 5.
Chapter 14 Solutions
Modern Business Statistics with Microsoft Excel (MindTap Course List)
Ch. 14.2 - Given are five observations for two variables, x...Ch. 14.2 - Given are five observations for two variables, x...Ch. 14.2 - Given are five observations collected in a...Ch. 14.2 - Retail and Trade: Female Managers. The following...Ch. 14.2 - Production Line Speed and Quality Control. Brawdy...Ch. 14.2 - The National Football League (NFL) records a...Ch. 14.2 - Sales Experience and Performance. A sales manager...Ch. 14.2 - Broker Satisfaction. The American Association of...Ch. 14.2 - Companies in the U.S. car rental market vary...Ch. 14.2 - Prob. 10E
Ch. 14.2 - Laptop Ratings. To help consumers in purchasing a...Ch. 14.2 - Prob. 12ECh. 14.2 - Distance and Absenteeism. A large city hospital...Ch. 14.2 - Using a global-positioning-system (GPS)-based...Ch. 14.3 - 15. The data from exercise 1...Ch. 14.3 - The data from exercise 2 follow.
The estimated...Ch. 14.3 - Prob. 17ECh. 14.3 - Price and Quality of Headphones. The following...Ch. 14.3 - Sales Experience and Sales Performance. In...Ch. 14.3 - Price and Weight of Bicycles. Bicycling, the...Ch. 14.3 - Cost Estimation. An important application of...Ch. 14.3 - 22. Refer to exercise 9, where the following data...Ch. 14.5 - The data from exercise 1 follow.
Compute the mean...Ch. 14.5 - The data from exercise 2 follow.
Compute the mean...Ch. 14.5 - The data from exercise 3 follow.
What is the...Ch. 14.5 - Prob. 26ECh. 14.5 - Prob. 27ECh. 14.5 - Broker Satisfaction Conclusion. In exercise 8,...Ch. 14.5 - Cost Estimation Conclusion. Refer to exercise 21,...Ch. 14.5 - Significance of Fleet Size on Rental Car Revenue....Ch. 14.5 - Significance of Racing Bike Weight on Price. In...Ch. 14.6 - 32. The data from exercise 1...Ch. 14.6 - 33. The data from exercise 2...Ch. 14.6 - Prob. 34ECh. 14.6 - 35. The following data are the monthly salaries y...Ch. 14.6 - 36. In exercise 7, the data on y = annual sales ($...Ch. 14.6 - In exercise 5, the following data on x = the...Ch. 14.6 - Prob. 38ECh. 14.6 - 39. In exercise 12, the following data on x =...Ch. 14.7 - The commercial division of a real estate firm...Ch. 14.7 - Following is a portion of the regression output...Ch. 14.7 - Out-of-state tuition and fees at the top graduate...Ch. 14.7 - Auto Racing Helmet. Automobile racing,...Ch. 14.8 - Prob. 45ECh. 14.8 - Prob. 46ECh. 14.8 - Prob. 47ECh. 14.8 - Prob. 48ECh. 14.8 - Prob. 49ECh. 14.9 - Consider the following data for two variables, x...Ch. 14.9 - Prob. 51ECh. 14.9 - Predicting Charity Expenses. Charity Navigator is...Ch. 14.9 - Many countries, especially those in Europe, have...Ch. 14.9 - Prob. 54ECh. 14 - The Dow Jones Industrial Average (DJIA) and the...Ch. 14 - Prob. 56SECh. 14 - Prob. 57SECh. 14 - Machine Maintenance. Jensen Tire & Auto is in the...Ch. 14 - Bus Maintenance. The regional transit authority...Ch. 14 - Reuters reported the market beta for Xerox was...Ch. 14 - Used Car Mileage and Price. The Toyota Camry is...Ch. 14 - Prob. 62SECh. 14 - One measure of the risk or volatility of an...Ch. 14 - As part of a study on transportation safety, the...Ch. 14 - Consumer Reports tested 166 different...Ch. 14 - When trying to decide what car to buy, real value...
Knowledge Booster


Learn more about
Need a deep-dive on the concept behind this application? Look no further. Learn more about this topic, statistics and related others by exploring similar questions and additional content below.Similar questions
- What do you guess are the standard deviations of the two distributions in the previous example problem?arrow_forwardPlease answer the questionsarrow_forward30. An individual who has automobile insurance from a certain company is randomly selected. Let Y be the num- ber of moving violations for which the individual was cited during the last 3 years. The pmf of Y isy | 1 2 4 8 16p(y) | .05 .10 .35 .40 .10 a.Compute E(Y).b. Suppose an individual with Y violations incurs a surcharge of $100Y^2. Calculate the expected amount of the surcharge.arrow_forward
- 24. An insurance company offers its policyholders a num- ber of different premium payment options. For a ran- domly selected policyholder, let X = the number of months between successive payments. The cdf of X is as follows: F(x)=0.00 : x < 10.30 : 1≤x<30.40 : 3≤ x < 40.45 : 4≤ x <60.60 : 6≤ x < 121.00 : 12≤ x a. What is the pmf of X?b. Using just the cdf, compute P(3≤ X ≤6) and P(4≤ X).arrow_forward59. At a certain gas station, 40% of the customers use regular gas (A1), 35% use plus gas (A2), and 25% use premium (A3). Of those customers using regular gas, only 30% fill their tanks (event B). Of those customers using plus, 60% fill their tanks, whereas of those using premium, 50% fill their tanks.a. What is the probability that the next customer will request plus gas and fill the tank (A2 B)?b. What is the probability that the next customer fills the tank?c. If the next customer fills the tank, what is the probability that regular gas is requested? Plus? Premium?arrow_forward38. Possible values of X, the number of components in a system submitted for repair that must be replaced, are 1, 2, 3, and 4 with corresponding probabilities .15, .35, .35, and .15, respectively. a. Calculate E(X) and then E(5 - X).b. Would the repair facility be better off charging a flat fee of $75 or else the amount $[150/(5 - X)]? [Note: It is not generally true that E(c/Y) = c/E(Y).]arrow_forward
- 74. The proportions of blood phenotypes in the U.S. popula- tion are as follows:A B AB O .40 .11 .04 .45 Assuming that the phenotypes of two randomly selected individuals are independent of one another, what is the probability that both phenotypes are O? What is the probability that the phenotypes of two randomly selected individuals match?arrow_forward53. A certain shop repairs both audio and video compo- nents. Let A denote the event that the next component brought in for repair is an audio component, and let B be the event that the next component is a compact disc player (so the event B is contained in A). Suppose that P(A) = .6 and P(B) = .05. What is P(BA)?arrow_forward26. A certain system can experience three different types of defects. Let A;(i = 1,2,3) denote the event that the sys- tem has a defect of type i. Suppose thatP(A1) = .12 P(A) = .07 P(A) = .05P(A, U A2) = .13P(A, U A3) = .14P(A2 U A3) = .10P(A, A2 A3) = .011Rshelfa. What is the probability that the system does not havea type 1 defect?b. What is the probability that the system has both type 1 and type 2 defects?c. What is the probability that the system has both type 1 and type 2 defects but not a type 3 defect? d. What is the probability that the system has at most two of these defects?arrow_forward
- The following are suggested designs for group sequential studies. Using PROCSEQDESIGN, provide the following for the design O’Brien Fleming and Pocock.• The critical boundary values for each analysis of the data• The expected sample sizes at each interim analysisAssume the standardized Z score method for calculating boundaries.Investigators are evaluating the success rate of a novel drug for treating a certain type ofbacterial wound infection. Since no existing treatment exists, they have planned a one-armstudy. They wish to test whether the success rate of the drug is better than 50%, whichthey have defined as the null success rate. Preliminary testing has estimated the successrate of the drug at 55%. The investigators are eager to get the drug into production andwould like to plan for 9 interim analyses (10 analyzes in total) of the data. Assume thesignificance level is 5% and power is 90%.Besides, draw a combined boundary plot (OBF, POC, and HP)arrow_forwardPlease provide the solution for the attached image in detailed.arrow_forward20 km, because GISS Worksheet 10 Jesse runs a small business selling and delivering mealie meal to the spaza shops. He charges a fixed rate of R80, 00 for delivery and then R15, 50 for each packet of mealle meal he delivers. The table below helps him to calculate what to charge his customers. 10 20 30 40 50 Packets of mealie meal (m) Total costs in Rands 80 235 390 545 700 855 (c) 10.1. Define the following terms: 10.1.1. Independent Variables 10.1.2. Dependent Variables 10.2. 10.3. 10.4. 10.5. Determine the independent and dependent variables. Are the variables in this scenario discrete or continuous values? Explain What shape do you expect the graph to be? Why? Draw a graph on the graph provided to represent the information in the table above. TOTAL COST OF PACKETS OF MEALIE MEAL 900 800 700 600 COST (R) 500 400 300 200 100 0 10 20 30 40 60 NUMBER OF PACKETS OF MEALIE MEALarrow_forward
arrow_back_ios
SEE MORE QUESTIONS
arrow_forward_ios
Recommended textbooks for you
 Functions and Change: A Modeling Approach to Coll...AlgebraISBN:9781337111348Author:Bruce Crauder, Benny Evans, Alan NoellPublisher:Cengage Learning
 Algebra and Trigonometry (MindTap Course List)AlgebraISBN:9781305071742Author:James Stewart, Lothar Redlin, Saleem WatsonPublisher:Cengage Learning
 College AlgebraAlgebraISBN:9781305115545Author:James Stewart, Lothar Redlin, Saleem WatsonPublisher:Cengage Learning
 Glencoe Algebra 1, Student Edition, 9780079039897...AlgebraISBN:9780079039897Author:CarterPublisher:McGraw Hill
 Big Ideas Math A Bridge To Success Algebra 1: Stu...AlgebraISBN:9781680331141Author:HOUGHTON MIFFLIN HARCOURTPublisher:Houghton Mifflin Harcourt
Functions and Change: A Modeling Approach to Coll...
Algebra
ISBN:9781337111348
Author:Bruce Crauder, Benny Evans, Alan Noell
Publisher:Cengage Learning
Algebra and Trigonometry (MindTap Course List)
Algebra
ISBN:9781305071742
Author:James Stewart, Lothar Redlin, Saleem Watson
Publisher:Cengage Learning
College Algebra
Algebra
ISBN:9781305115545
Author:James Stewart, Lothar Redlin, Saleem Watson
Publisher:Cengage Learning
Glencoe Algebra 1, Student Edition, 9780079039897...
Algebra
ISBN:9780079039897
Author:Carter
Publisher:McGraw Hill
Big Ideas Math A Bridge To Success Algebra 1: Stu...
Algebra
ISBN:9781680331141
Author:HOUGHTON MIFFLIN HARCOURT
Publisher:Houghton Mifflin Harcourt
Correlation Vs Regression: Difference Between them with definition & Comparison Chart; Author: Key Differences;https://www.youtube.com/watch?v=Ou2QGSJVd0U;License: Standard YouTube License, CC-BY
Correlation and Regression: Concepts with Illustrative examples; Author: LEARN & APPLY : Lean and Six Sigma;https://www.youtube.com/watch?v=xTpHD5WLuoA;License: Standard YouTube License, CC-BY