
Concept explainers
Videos
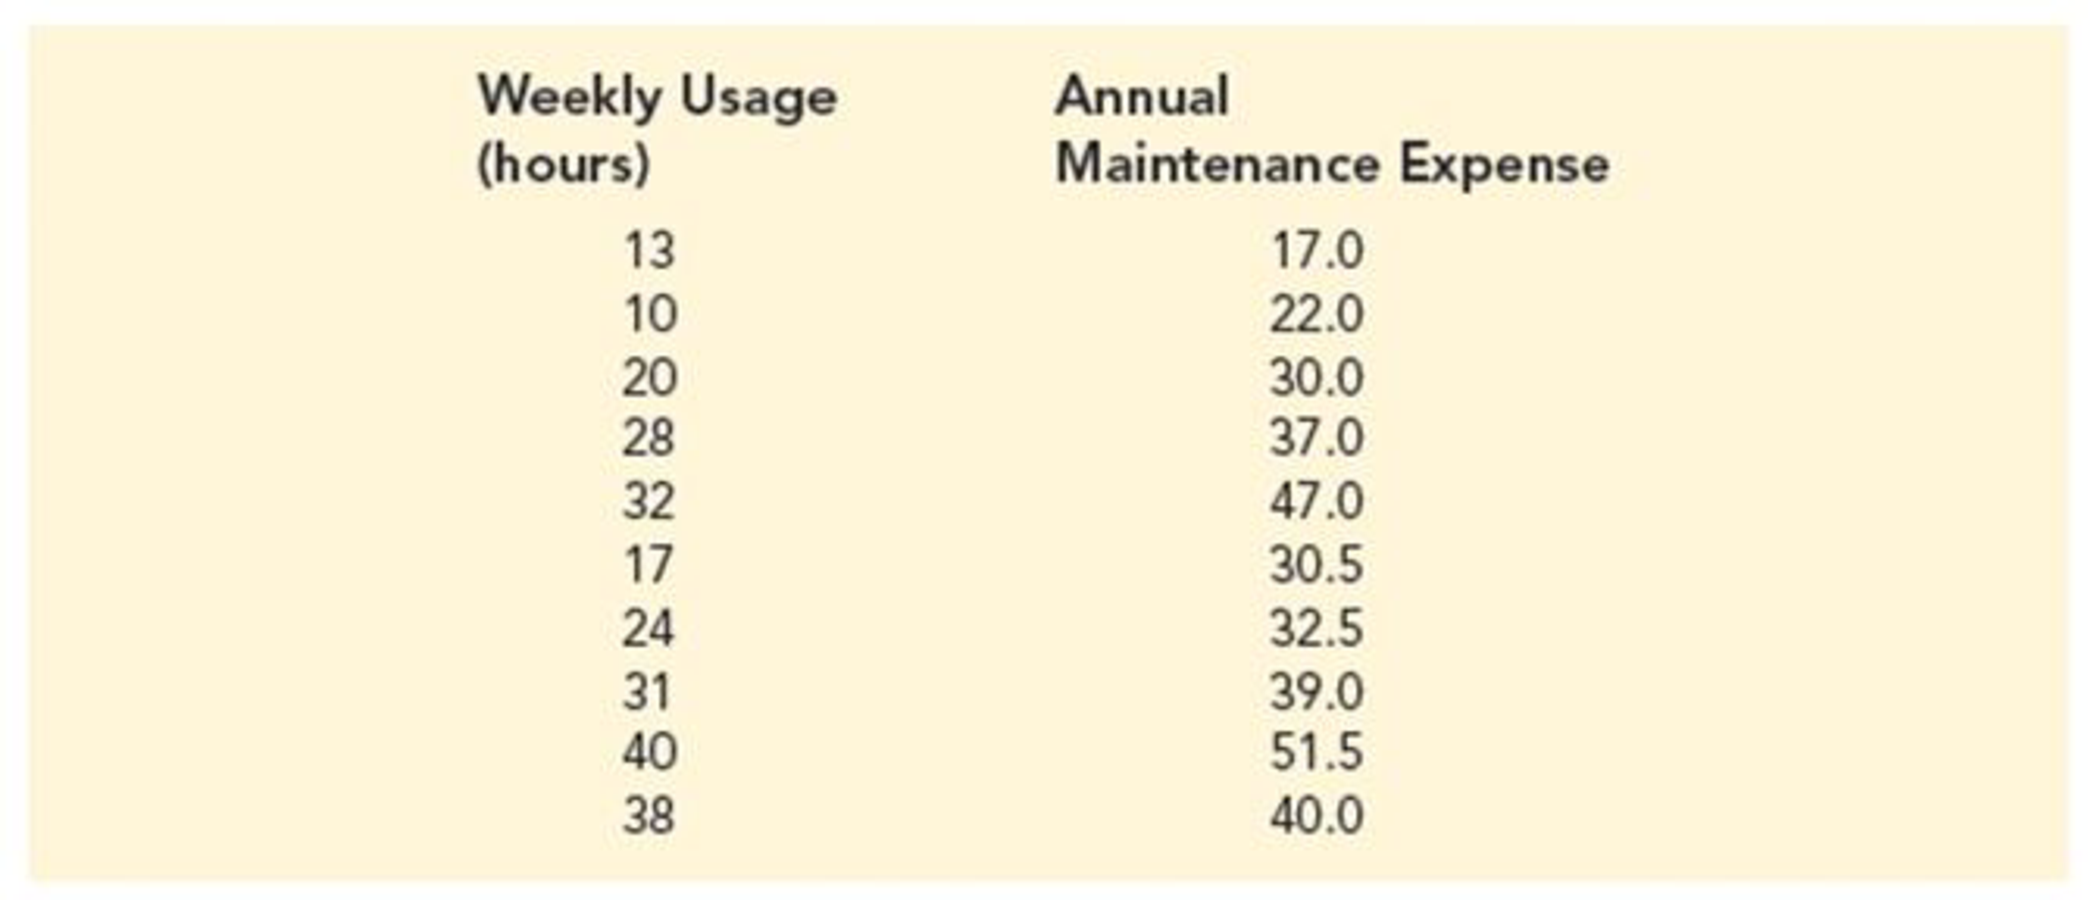
Machine Maintenance. Jensen Tire & Auto is in the process of deciding whether to purchase a maintenance contract for its new computer wheel alignment and balancing machine. Managers feel that maintenance expense should be related to usage, and they collected the following information on weekly usage (hours) and annual maintenance expense (in hundreds of dollars).
- a. Develop the estimated regression equation that relates annual maintenance expense to weekly usage.
- b. Test the significance of the relationship in part (a) at a .05 level of significance.
- c. Jensen expects to use the new machine 30 hours per week. Develop a 95% prediction interval for the company’s annual maintenance expense.
- d. If the maintenance contract costs $3000 per year, would you recommend purchasing it? Why or why not?
a.
Find the estimated regression equation that relates annual maintenance expense to weekly usage.
Answer to Problem 58SE
The estimated regression equation is
Explanation of Solution
Calculation:
The data related to the weekly usage (hours) and Annual Maintenance Expense (in hundreds of dollars) to purchase a maintenance contract for new computer wheel alignment and balancing machine.
Regression:
Software procedure:
Step-by-step procedure to obtain the estimated regression equation using Excel:
- In Excel sheet, enter Size and Selling Price in different columns.
- In Data, select Data Analysis and choose Regression.
- In Input Y Range, select Expense.
- In Input X Range, select Usage.
- Select Labels.
- Click OK.
Output obtained using Excel is given below:
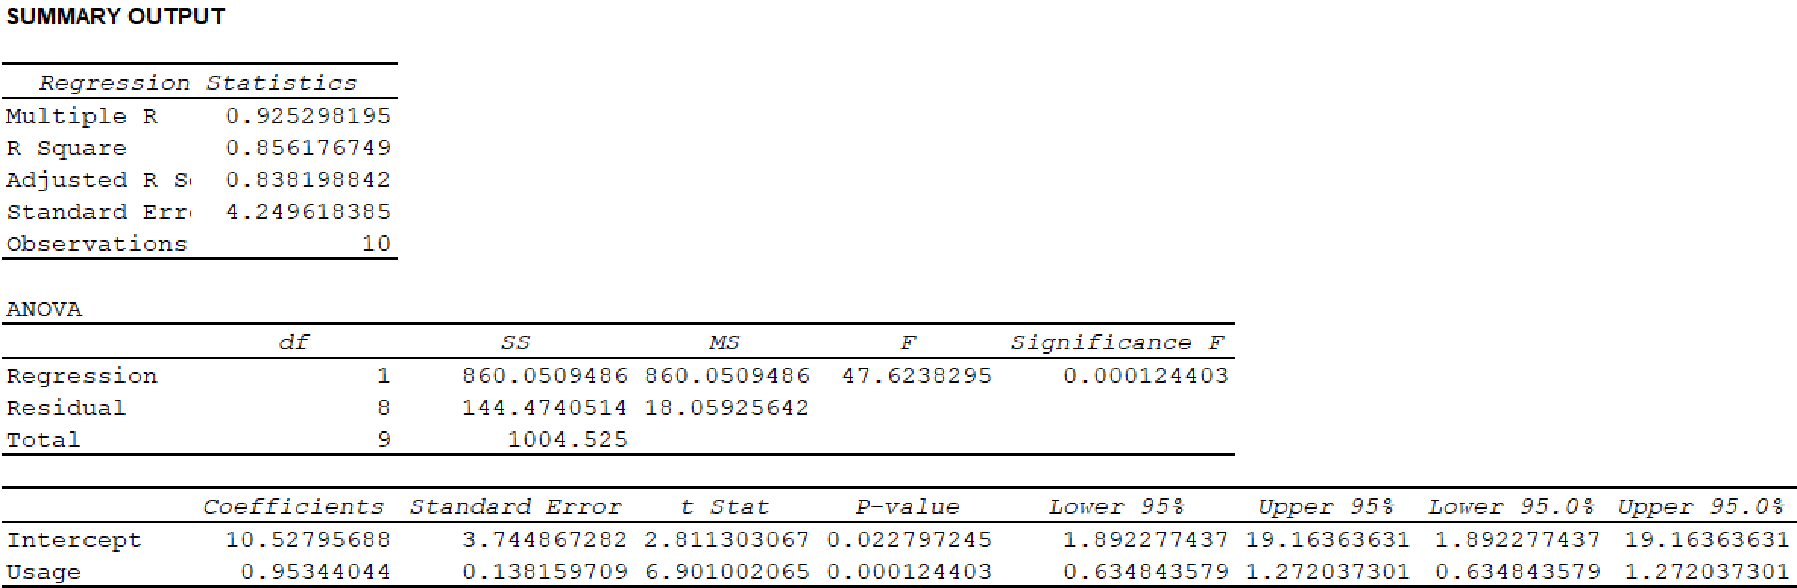
Thus, the estimated regression equation is
b.
Test for a significant relationship at
Answer to Problem 58SE
There is a significant relationship between annual maintenance expense and weekly usage.
Explanation of Solution
Calculation:
State the test hypotheses.
Null hypothesis:
That is, there is no significant relationship between expense and usage.
Alternative hypothesis:
That is, there is a significant relationship between expense and usage.
From the output in Part (a) it is found that the F-test statistic is 47.62.
Level of significance:
The given level of significance is
p-value:
From the output in pat (a) it is found that the p-value is 0.00.
Rejection rule:
If the
Conclusion:
Here, the p-value is less than the level of significance.
That is,
Thus, the decision is “reject the null hypothesis”.
Therefore, the data provide sufficient evidence to conclude that there is a significant relationship between expense and usage.
Thus, annual maintenance expense and weekly usage are related.
c.
Find a 95% prediction interval for the company’s annual maintenance expense.
Answer to Problem 58SE
The 95% prediction interval for the company’s annual maintenance expense is
Explanation of Solution
Calculation:
For a sample of size n, the degrees of freedom is given as
In this given problem, for sample of size 10, the degrees of freedom is as follows:
Thus, the degrees of freedom is 8.
Level of significance:
The given level of significance is
For two-tails distribution, the value is as follows:
Form the table 2 of “t Distribution” in Appendix B, it is found that the value of t test statistic with level of significance 0.025 and degrees of freedom 8 is
According to the regression equation
Thus, the possible value of dependent variable y when
The estimate of standard deviation corresponding to the prediction of the value of
It is known for a sample size n that mean of a random variable x can be obtained as follows:
Thus, mean of the random variable x is given below:
The value of
| 13 | 151.29 |
| 10 | 234.09 |
| 20 | 28.09 |
| 28 | 7.29 |
| 32 | 44.89 |
| 17 | 68.89 |
| 24 | 1.69 |
| 31 | 32.49 |
| 40 | 216.09 |
| 38 | 161.29 |
| Total | 946.1 |
Here, it is found that,
From the output, the value of given MSE for sample of size 10 is
The standard error of the estimate is obtained as follows:
Thus, the standard error of the estimate is 4.2496.
It is also found that for
For
Thus, the standard deviation of an individual value of y for
The prediction interval for expected value of
Therefore, the required prediction interval is given below:
Thus, the 95% prediction interval for the company’s annual maintenance expense is
d.
Explain whether it is recommended purchase a machine of the maintenance costs of $3,000 per year.
Explanation of Solution
Calculation:
The estimated regression equation is
Substitute 30 for usage in estimated regression equation.
In this case, the expected expense is 39.12 or $3,912. Therefore, it is recommended purchase a machine of the maintenance costs of $3,000 per year.
Want to see more full solutions like this?
Chapter 14 Solutions
Modern Business Statistics with Microsoft Excel (MindTap Course List)


- Question 2: When John started his first job, his first end-of-year salary was $82,500. In the following years, he received salary raises as shown in the following table. Fill the Table: Fill the following table showing his end-of-year salary for each year. I have already provided the end-of-year salaries for the first three years. Calculate the end-of-year salaries for the remaining years using Excel. (If you Excel answer for the top 3 cells is not the same as the one in the following table, your formula / approach is incorrect) (2 points) Geometric Mean of Salary Raises: Calculate the geometric mean of the salary raises using the percentage figures provided in the second column named “% Raise”. (The geometric mean for this calculation should be nearly identical to the arithmetic mean. If your answer deviates significantly from the mean, it's likely incorrect. 2 points) Starting salary % Raise Raise Salary after raise 75000 10% 7500 82500 82500 4% 3300…arrow_forwardI need help with this problem and an explanation of the solution for the image described below. (Statistics: Engineering Probabilities)arrow_forwardI need help with this problem and an explanation of the solution for the image described below. (Statistics: Engineering Probabilities)arrow_forward
- 310015 K Question 9, 5.2.28-T Part 1 of 4 HW Score: 85.96%, 49 of 57 points Points: 1 Save of 6 Based on a poll, among adults who regret getting tattoos, 28% say that they were too young when they got their tattoos. Assume that six adults who regret getting tattoos are randomly selected, and find the indicated probability. Complete parts (a) through (d) below. a. Find the probability that none of the selected adults say that they were too young to get tattoos. 0.0520 (Round to four decimal places as needed.) Clear all Final check Feb 7 12:47 US Oarrow_forwardhow could the bar graph have been organized differently to make it easier to compare opinion changes within political partiesarrow_forwardDraw a picture of a normal distribution with mean 70 and standard deviation 5.arrow_forward
- What do you guess are the standard deviations of the two distributions in the previous example problem?arrow_forwardPlease answer the questionsarrow_forward30. An individual who has automobile insurance from a certain company is randomly selected. Let Y be the num- ber of moving violations for which the individual was cited during the last 3 years. The pmf of Y isy | 1 2 4 8 16p(y) | .05 .10 .35 .40 .10 a.Compute E(Y).b. Suppose an individual with Y violations incurs a surcharge of $100Y^2. Calculate the expected amount of the surcharge.arrow_forward
- 24. An insurance company offers its policyholders a num- ber of different premium payment options. For a ran- domly selected policyholder, let X = the number of months between successive payments. The cdf of X is as follows: F(x)=0.00 : x < 10.30 : 1≤x<30.40 : 3≤ x < 40.45 : 4≤ x <60.60 : 6≤ x < 121.00 : 12≤ x a. What is the pmf of X?b. Using just the cdf, compute P(3≤ X ≤6) and P(4≤ X).arrow_forward59. At a certain gas station, 40% of the customers use regular gas (A1), 35% use plus gas (A2), and 25% use premium (A3). Of those customers using regular gas, only 30% fill their tanks (event B). Of those customers using plus, 60% fill their tanks, whereas of those using premium, 50% fill their tanks.a. What is the probability that the next customer will request plus gas and fill the tank (A2 B)?b. What is the probability that the next customer fills the tank?c. If the next customer fills the tank, what is the probability that regular gas is requested? Plus? Premium?arrow_forward38. Possible values of X, the number of components in a system submitted for repair that must be replaced, are 1, 2, 3, and 4 with corresponding probabilities .15, .35, .35, and .15, respectively. a. Calculate E(X) and then E(5 - X).b. Would the repair facility be better off charging a flat fee of $75 or else the amount $[150/(5 - X)]? [Note: It is not generally true that E(c/Y) = c/E(Y).]arrow_forward
 Functions and Change: A Modeling Approach to Coll...AlgebraISBN:9781337111348Author:Bruce Crauder, Benny Evans, Alan NoellPublisher:Cengage Learning
 Algebra and Trigonometry (MindTap Course List)AlgebraISBN:9781305071742Author:James Stewart, Lothar Redlin, Saleem WatsonPublisher:Cengage Learning
 Glencoe Algebra 1, Student Edition, 9780079039897...AlgebraISBN:9780079039897Author:CarterPublisher:McGraw Hill
 College AlgebraAlgebraISBN:9781305115545Author:James Stewart, Lothar Redlin, Saleem WatsonPublisher:Cengage Learning
 Big Ideas Math A Bridge To Success Algebra 1: Stu...AlgebraISBN:9781680331141Author:HOUGHTON MIFFLIN HARCOURTPublisher:Houghton Mifflin Harcourt