Mathematics All Around (6th Edition)
6th Edition
ISBN: 9780134506470
Author: Pirnot
Publisher: PEARSON
expand_more
expand_more
format_list_bulleted
Question
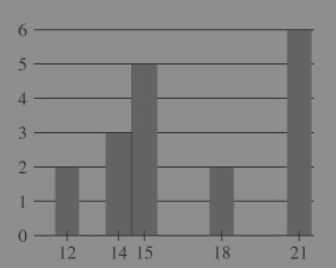
Chapter 14.2, Problem 10E
To determine
To calculate:
The mean, median and mode of the distribution using the graph given below.
Expert Solution & Answer
Want to see the full answer?
Check out a sample textbook solution
Students have asked these similar questions
Answer questions 8.2.6, 8.2.7 and 8.2.9 respectively
To the Internal Revenue Service, the reasonableness of total itemized deductions depends on the taxpayer’s adjusted gross income. Large deductions, which include charity and medical deductions, are more reasonable for taxpayers with large adjusted gross incomes. If a taxpayer claims larger than average itemized deductions for a given level of income, the chances of an IRS audit are increased. Data (in thousands of dollars) on adjusted gross income and the average or reasonable amount of itemized deductions follow.
Adjusted Gross Income ($1000s)
Reasonable Amount ofItemized Deductions ($1000s)
22
9.6
27
9.6
32
10.1
48
11.1
65
13.5
85
17.7
120
25.5
Compute b1 and b0 (to 4 decimals).b1 b0 Complete the estimated regression equation (to 2 decimals). = + x
Predict a reasonable level of total itemized deductions for a taxpayer with an adjusted gross income of $52.5 thousand (to 2 decimals). thousand dollarsWhat is the value, in dollars, of…
Answer questions 8.1.10, 8.1.11and 8.1.12 respectively
Chapter 14 Solutions
Mathematics All Around (6th Edition)
Ch. 14.1 - Sharpening Your Skills. In Exercises 1 and 2,...Ch. 14.1 - Sharpening Your Skills. In Exercises 1 and 2,...Ch. 14.1 - Sharpening Your Skills. In Exercises 3 and 4,...Ch. 14.1 - Sharpening Your Skills. In Exercises 3 and 4,...Ch. 14.1 - Sharpening Your Skills. In Exercises 5 and 6,...Ch. 14.1 - Sharpening Your Skills. In Exercises 5 and 6,...Ch. 14.1 - Prob. 7ECh. 14.1 - Sharpening Your Skills. In Exercises 7 and 8,...Ch. 14.1 - Prob. 9ECh. 14.1 - Sharpening Your Skills. In Exercises 9 and 10,...
Ch. 14.1 - Prob. 11ECh. 14.1 - Prob. 12ECh. 14.1 - Applying What Youve Learned. Customers at...Ch. 14.1 - Applying What Youve Learned. Scheduling a rec...Ch. 14.1 - Applying What Youve Learned. Data similar to that...Ch. 14.1 - Applying What Youve Learned. Data similar to that...Ch. 14.1 - Comparing wage data. The following bar graphs...Ch. 14.1 - Applying What Youve Lerarned. Comparing wage data....Ch. 14.1 - Applying What Youve Learned. Comparing wage data....Ch. 14.1 - Applying What Youve Learned. Comparing wage data....Ch. 14.1 - Applying What Youve Learned. Comparing wage data....Ch. 14.1 - Prob. 22ECh. 14.1 - Prob. 23ECh. 14.1 - Prob. 24ECh. 14.1 - Prob. 25ECh. 14.1 - For Exercises 23 26, use the four graphs of the...Ch. 14.1 - Applying What Youve Learned. Comparing training...Ch. 14.1 - Applying What Youve Learned. Comparing weight-loss...Ch. 14.1 - Applying What Youve Learned. Super Bowl scores....Ch. 14.1 - Applying What Youve Learned. Law School Aptitude...Ch. 14.1 - In Exercises 31 34, first group the data using an...Ch. 14.1 - Applying What Youve Learned. In Exercises 31 34,...Ch. 14.1 - In Exercises 31 34, first group the data using an...Ch. 14.1 - Applying What Youve Learned. In Exercises 31 34,...Ch. 14.1 - Communicating Mathematics What is the difference...Ch. 14.1 - Communicating Mathematics If you are using a bar...Ch. 14.1 - Communicating Mathematics What is the difference...Ch. 14.1 - Communicating Mathematics What do you see as an...Ch. 14.1 - Challenge Yourself How might you present three...Ch. 14.1 - Challenge Yourself 42. The following table is an...Ch. 14.2 - Prob. 1ECh. 14.2 - Prob. 2ECh. 14.2 - Sharpening Your Skills Find the mean, median, and...Ch. 14.2 - Prob. 4ECh. 14.2 - Prob. 5ECh. 14.2 - Prob. 6ECh. 14.2 - Prob. 7ECh. 14.2 - Prob. 8ECh. 14.2 - Prob. 9ECh. 14.2 - Prob. 10ECh. 14.2 - Prob. 11ECh. 14.2 - Prob. 12ECh. 14.2 - Prob. 13ECh. 14.2 - Prob. 14ECh. 14.2 - Prob. 15ECh. 14.2 - Prob. 16ECh. 14.2 - In Exercises 1720, a give the five-number summary...Ch. 14.2 - Prob. 18ECh. 14.2 - In Exercises 1720, a give the five-number summary...Ch. 14.2 - In Exercises 1720, a give the five-number summary...Ch. 14.2 - In Exercises 2128, find the mean, median, and mode...Ch. 14.2 - In Exercises 2128, find the mean, median, and mode...Ch. 14.2 - In Exercises 2128, find the mean, median, and mode...Ch. 14.2 - In Exercises 2128, find the mean, median, and mode...Ch. 14.2 - In Exercises 2128, find the mean, median, and mode...Ch. 14.2 - In Exercises 2128, find the mean, median, and mode...Ch. 14.2 - In Exercises 2128, find the mean, median, and mode...Ch. 14.2 - In Exercises 2128, find the mean, median, and mode...Ch. 14.2 - Many colleges assign numerical points to grades as...Ch. 14.2 - Prob. 30ECh. 14.2 - Exam scores. Izzy had an 84 and an 86 on his first...Ch. 14.2 - Prob. 32ECh. 14.2 - Prob. 33ECh. 14.2 - Prob. 34ECh. 14.2 - Exam scores. Assume that in your History of Film...Ch. 14.2 - Prob. 36ECh. 14.2 - Prob. 37ECh. 14.2 - Prob. 38ECh. 14.2 - Prob. 39ECh. 14.2 - Example 6 Using Stem-and-Leaf Home Run Records...Ch. 14.2 - Prob. 41ECh. 14.2 - Prob. 42ECh. 14.2 - Prob. 43ECh. 14.2 - Prob. 44ECh. 14.2 - Prob. 45ECh. 14.2 - Prob. 46ECh. 14.2 - Prob. 47ECh. 14.2 - A college placement office has made a comparative...Ch. 14.2 - Prob. 49ECh. 14.2 - Prob. 50ECh. 14.2 - Give three separate real-life examples in which...Ch. 14.2 - Which measure of central tendency do you think is...Ch. 14.2 - Manipulating data. Choose some set of data...Ch. 14.2 - Analyzing misleading graphs. Find a graph in the...Ch. 14.2 - Prob. 55ECh. 14.2 - Prob. 56ECh. 14.2 - Prob. 57ECh. 14.2 - Prob. 58ECh. 14.2 - Prob. 59ECh. 14.2 - Prob. 60ECh. 14.2 - Prob. 61ECh. 14.2 - Prob. 62ECh. 14.2 - Prob. 63ECh. 14.2 - Prob. 64ECh. 14.2 - Prob. 65ECh. 14.3 - Sharpening Your Skills Find the range, mean, and...Ch. 14.3 - Sharpening Your Skills Find the range, mean, and...Ch. 14.3 - Sharpening Your Skills Find the range, mean, and...Ch. 14.3 - Sharpening Your Skills Find the range, mean, and...Ch. 14.3 - Sharpening Your Skills Find the range, mean, and...Ch. 14.3 - Sharpening Your Skills Find the range, mean, and...Ch. 14.3 - Sharpening Your Skills Find the range, mean, and...Ch. 14.3 - Sharpening Your Skills Find the range, mean, and...Ch. 14.3 - Prob. 9ECh. 14.3 - Prob. 10ECh. 14.3 - Prob. 11ECh. 14.3 - Prob. 12ECh. 14.3 - Prob. 13ECh. 14.3 - Prob. 14ECh. 14.3 - Prob. 15ECh. 14.3 - Prob. 16ECh. 14.3 - Prob. 17ECh. 14.3 - Prob. 18ECh. 14.3 - Prob. 19ECh. 14.3 - Applying What Youve Learned Summarizing age data....Ch. 14.3 - Prob. 21ECh. 14.3 - Prob. 22ECh. 14.3 - Prob. 23ECh. 14.3 - Prob. 24ECh. 14.3 - Prob. 25ECh. 14.3 - Prob. 26ECh. 14.3 - Prob. 27ECh. 14.3 - Prob. 28ECh. 14.3 - Prob. 29ECh. 14.3 - Prob. 30ECh. 14.3 - In Exercises 31 and 32, we present information on...Ch. 14.3 - In Exercises 31 and 32, we present information on...Ch. 14.3 - Human resources. As the manager of the human...Ch. 14.3 - Prob. 34ECh. 14.3 - Prob. 35ECh. 14.3 - Prob. 36ECh. 14.3 - Prob. 37ECh. 14.3 - Prob. 38ECh. 14.3 - Laptop batteries. A particular brand of laptop was...Ch. 14.3 - Study times. A group of students were sampled with...Ch. 14.3 - Prob. 41ECh. 14.3 - Prob. 42ECh. 14.3 - Prob. 43ECh. 14.3 - Use the following graphs for Exercise 44 a. Which...Ch. 14.3 - Prob. 45ECh. 14.3 - Prob. 46ECh. 14.3 - Prob. 47ECh. 14.3 - Prob. 48ECh. 14.4 - Assume that the distribution in Exercises 1 6 has...Ch. 14.4 - Assume that the distribution in Exercises 1 6 has...Ch. 14.4 - Assume that the distribution in Exercises 1 6 has...Ch. 14.4 - Assume that the distribution in Exercises 1 6 has...Ch. 14.4 - Assume that the distribution in Exercises 1 6 has...Ch. 14.4 - Assume that the distribution in Exercises 1 6 has...Ch. 14.4 - Assume that the distribution in Exercises 7 12...Ch. 14.4 - Assume that the distribution in Exercises 7 12...Ch. 14.4 - Assume that the distribution in Exercises 7 12...Ch. 14.4 - Assume that the distribution in Exercises 7 12...Ch. 14.4 - Assume that the distribution in Exercises 7 12...Ch. 14.4 - Assume that the distribution in Exercises 7 12...Ch. 14.4 - Use the following graph of the standard normal...Ch. 14.4 - Use the following graph of the standard normal...Ch. 14.4 - Use Table 14.19 to find the percent of the area...Ch. 14.4 - Use Table 14.19 to find the percent of the area...Ch. 14.4 - Use Table 14.19 to find the percent of the area...Ch. 14.4 - Prob. 18ECh. 14.4 - Prob. 19ECh. 14.4 - Prob. 20ECh. 14.4 - Prob. 21ECh. 14.4 - Prob. 22ECh. 14.4 - Use Table 14.19 to find the percent of the area...Ch. 14.4 - Prob. 24ECh. 14.4 - Use Table 14.19 to find the percent of the area...Ch. 14.4 - Use Table 14.19 to find the percent of the area...Ch. 14.4 - Use Table 14.19 to find the percent of the area...Ch. 14.4 - Prob. 28ECh. 14.4 - Use Table 14.19 to find the percent of the area...Ch. 14.4 - Prob. 30ECh. 14.4 - Use Table 14.19 to find the percent of the area...Ch. 14.4 - Prob. 32ECh. 14.4 - Use Table 14.19 to find the percent of the area...Ch. 14.4 - Prob. 34ECh. 14.4 - Prob. 35ECh. 14.4 - In Exercises 35 - 40, we give you a mean, a...Ch. 14.4 - Prob. 37ECh. 14.4 - Prob. 38ECh. 14.4 - Prob. 39ECh. 14.4 - Prob. 40ECh. 14.4 - Prob. 41ECh. 14.4 - In Exercises 41 - 46, we give you a mean, a...Ch. 14.4 - Prob. 43ECh. 14.4 - Prob. 44ECh. 14.4 - Prob. 45ECh. 14.4 - Prob. 46ECh. 14.4 - Prob. 47ECh. 14.4 - Prob. 48ECh. 14.4 - Prob. 49ECh. 14.4 - Prob. 50ECh. 14.4 - Prob. 51ECh. 14.4 - Prob. 52ECh. 14.4 - Prob. 53ECh. 14.4 - Prob. 54ECh. 14.4 - Prob. 55ECh. 14.4 - Prob. 56ECh. 14.4 - Prob. 57ECh. 14.4 - Prob. 58ECh. 14.4 - Prob. 59ECh. 14.4 - Prob. 60ECh. 14.4 - Prob. 61ECh. 14.4 - Prob. 62ECh. 14.4 - Prob. 63ECh. 14.4 - Weight lifting.In a power lifting competition the...Ch. 14.4 - Strength of cables.A certain type of cable has a...Ch. 14.4 - Prob. 66ECh. 14.4 - Prob. 67ECh. 14.4 - Prob. 68ECh. 14.4 - Prob. 69ECh. 14.4 - Prob. 70ECh. 14.4 - Prob. 71ECh. 14.4 - Prob. 72ECh. 14.4 - Prob. 73ECh. 14.4 - Prob. 74ECh. 14.4 - Analyzing the SATs. Assume that the math SAT...Ch. 14.4 - Prob. 76ECh. 14.4 - Prob. 77ECh. 14.4 - Prob. 78ECh. 14.4 - Prob. 79ECh. 14.4 - Prob. 80ECh. 14.4 - Prob. 81ECh. 14.4 - Prob. 82ECh. 14.4 - Prob. 83ECh. 14.4 - Prob. 84ECh. 14.4 - Prob. 85ECh. 14.4 - Prob. 86ECh. 14.4 - If a distribution has a mean of 40 and a standard...Ch. 14.4 - Prob. 88ECh. 14.4 - Prob. 89ECh. 14.4 - Prob. 90ECh. 14.5 - In Exercises 1 and 2, state what kind of...Ch. 14.5 - In Exercises 1 and 2, state what kind of...Ch. 14.5 - For Exercises 3 6, do the following: a. Plot the...Ch. 14.5 - Prob. 4ECh. 14.5 - Prob. 5ECh. 14.5 - Prob. 6ECh. 14.5 - Prob. 7ECh. 14.5 - Prob. 8ECh. 14.5 - Prob. 9ECh. 14.5 - Prob. 10ECh. 14.5 - Prob. 11ECh. 14.5 - Prob. 12ECh. 14.5 - In Exercises 11 14, find the line of best fit for...Ch. 14.5 - Prob. 14ECh. 14.5 - Prob. 15ECh. 14.5 - Prob. 16ECh. 14.5 - Prob. 17ECh. 14.5 - Prob. 18ECh. 14.5 - In Exercises 19 22, find the line of best fit for...Ch. 14.5 - In Exercises 19 22, find the line of best fit for...Ch. 14.5 - In Exercises 19 22, find the line of best fit for...Ch. 14.5 - In Exercises 19 22, find the line of best fit for...Ch. 14.5 - In Example 3, we found the absolute value of the...Ch. 14.5 - Prob. 24ECh. 14.5 - Prob. 25ECh. 14.5 - Prob. 26ECh. 14.5 - Prob. 27ECh. 14.CR - Prob. 1CRCh. 14.CR - Prob. 2CRCh. 14.CR - Prob. 3CRCh. 14.CR - Prob. 4CRCh. 14.CR - The lists represent the ages of actors M and...Ch. 14.CR - Prob. 6CRCh. 14.CR - Prob. 7CRCh. 14.CR - Prob. 8CRCh. 14.CR - Prob. 9CRCh. 14.CR - Prob. 10CRCh. 14.CR - Prob. 11CRCh. 14.CR - Prob. 12CRCh. 14.CR - Prob. 13CRCh. 14.CR - Prob. 14CRCh. 14.CR - Prob. 15CRCh. 14.CR - Prob. 16CRCh. 14.CR - Prob. 17CRCh. 14.CR - State what kind of correlation, if any, is...Ch. 14.CR - Prob. 19CRCh. 14.CT - Prob. 1CTCh. 14.CT - Prob. 2CTCh. 14.CT - Prob. 3CTCh. 14.CT - Prob. 4CTCh. 14.CT - Prob. 5CTCh. 14.CT - Prob. 6CTCh. 14.CT - Prob. 7CTCh. 14.CT - Prob. 8CTCh. 14.CT - Prob. 9CTCh. 14.CT - Prob. 10CTCh. 14.CT - Prob. 11CTCh. 14.CT - Prob. 12CTCh. 14.CT - Prob. 13CTCh. 14.CT - Prob. 14CTCh. 14.CT - Prob. 15CTCh. 14.CT - Prob. 16CTCh. 14.CT - Prob. 17CTCh. 14.CT - Prob. 18CT
Knowledge Booster

Similar questions
- 7.2.10 Researchers in the Hopkins Forest also count the number of maple trees (genus acer) in plots throughout the forest. The following is a histogram of the number of live maples in 1002 plots sampled over the past 20 years. The average number of maples per plot was 19.86 trees with a standard deviation of 23.65 trees. a. If we took the mean of a sample of eight plots, what would be the standard error of the mean? b. Using the central limit theorem, what is the probability that the mean of the eight would be within 1 standard error of the mean? c. Why might you think that the probability that you calculated in (b) might not be very accurate? 2. A normal population has mean 100 and variance 25. How large must the random sample be if you want the standard error of the sample average to be 1.5?arrow_forwardAnswer questions 7.3.10 and 7.3.12 respectively 7.3.12. Suppose that two independent random samples (of size n1 and n2) from two normal distributions are available. Explain how you would estimate the standard error of the difference in sample means X1 − X2 with the bootstrap method.arrow_forwardAnswer questions 7.4.6 and 7.4.7 respectivelyarrow_forward
- Write an equation for the function shown. You may assume all intercepts and asymptotes are on integers. The blue dashed lines are the asymptotes. 10 9- 8- 7 6 5 4- 3- 2 4 5 15-14-13-12-11-10 -9 -8 -7 -6 -5 -4 -3 -2 1 1 2 3 -1 -2 -3 -4 1 -5 -6- -7 -8- -9 -10+ 60 7 8 9 10 11 12 13 14 15arrow_forwardK The mean height of women in a country (ages 20-29) is 63.7 inches. A random sample of 65 women in this age group is selected. What is the probability that the mean height for the sample is greater than 64 inches? Assume σ = 2.68. The probability that the mean height for the sample is greater than 64 inches is (Round to four decimal places as needed.)arrow_forwardAnswer questions 8.1.4, 8.1.5 and 8.1.6 respectivelyarrow_forward
- Answer questions 8.1.1, 8.1.2 and 8.1.3 respectivelyarrow_forwardAnswer questions 7.4.1 , 7.4.2 and 7.4.3 respectivelyarrow_forwardIn a survey of a group of men, the heights in the 20-29 age group were normally distributed, with a mean of 69.6 inches and a standard deviation of 4.0 inches. A study participant is randomly selected. Complete parts (a) through (d) below. (a) Find the probability that a study participant has a height that is less than 68 inches. The probability that the study participant selected at random is less than 68 inches tall is 0.4. (Round to four decimal places as needed.) 20 2arrow_forward
arrow_back_ios
SEE MORE QUESTIONS
arrow_forward_ios
Recommended textbooks for you
 Discrete Mathematics and Its Applications ( 8th I...MathISBN:9781259676512Author:Kenneth H RosenPublisher:McGraw-Hill Education
 Mathematics for Elementary Teachers with Activiti...MathISBN:9780134392790Author:Beckmann, SybillaPublisher:PEARSON
 Thinking Mathematically (7th Edition)MathISBN:9780134683713Author:Robert F. BlitzerPublisher:PEARSON
 Discrete Mathematics With ApplicationsMathISBN:9781337694193Author:EPP, Susanna S.Publisher:Cengage Learning,
 Pathways To Math Literacy (looseleaf)MathISBN:9781259985607Author:David Sobecki Professor, Brian A. MercerPublisher:McGraw-Hill Education
Discrete Mathematics and Its Applications ( 8th I...
Math
ISBN:9781259676512
Author:Kenneth H Rosen
Publisher:McGraw-Hill Education
Mathematics for Elementary Teachers with Activiti...
Math
ISBN:9780134392790
Author:Beckmann, Sybilla
Publisher:PEARSON
Thinking Mathematically (7th Edition)
Math
ISBN:9780134683713
Author:Robert F. Blitzer
Publisher:PEARSON
Discrete Mathematics With Applications
Math
ISBN:9781337694193
Author:EPP, Susanna S.
Publisher:Cengage Learning,
Pathways To Math Literacy (looseleaf)
Math
ISBN:9781259985607
Author:David Sobecki Professor, Brian A. Mercer
Publisher:McGraw-Hill Education