Mathematics All Around (6th Edition)
6th Edition
ISBN: 9780134506470
Author: Pirnot
Publisher: PEARSON
expand_more
expand_more
format_list_bulleted
Videos
Question
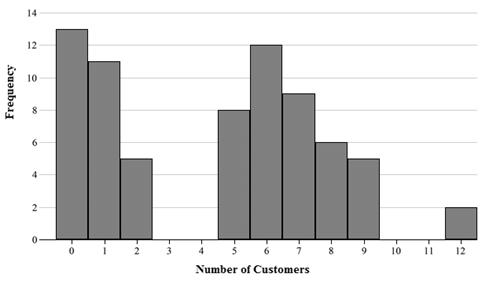
Chapter 14.3, Problem 23E
To determine
To find:
The mean and standard deviation of the distribution given by the following graph:
Expert Solution & Answer
Want to see the full answer?
Check out a sample textbook solution
Students have asked these similar questions
please show all the work
please show all the work
please show all the work
Chapter 14 Solutions
Mathematics All Around (6th Edition)
Ch. 14.1 - Sharpening Your Skills. In Exercises 1 and 2,...Ch. 14.1 - Sharpening Your Skills. In Exercises 1 and 2,...Ch. 14.1 - Sharpening Your Skills. In Exercises 3 and 4,...Ch. 14.1 - Sharpening Your Skills. In Exercises 3 and 4,...Ch. 14.1 - Sharpening Your Skills. In Exercises 5 and 6,...Ch. 14.1 - Sharpening Your Skills. In Exercises 5 and 6,...Ch. 14.1 - Prob. 7ECh. 14.1 - Sharpening Your Skills. In Exercises 7 and 8,...Ch. 14.1 - Prob. 9ECh. 14.1 - Sharpening Your Skills. In Exercises 9 and 10,...
Ch. 14.1 - Prob. 11ECh. 14.1 - Prob. 12ECh. 14.1 - Applying What Youve Learned. Customers at...Ch. 14.1 - Applying What Youve Learned. Scheduling a rec...Ch. 14.1 - Applying What Youve Learned. Data similar to that...Ch. 14.1 - Applying What Youve Learned. Data similar to that...Ch. 14.1 - Comparing wage data. The following bar graphs...Ch. 14.1 - Applying What Youve Lerarned. Comparing wage data....Ch. 14.1 - Applying What Youve Learned. Comparing wage data....Ch. 14.1 - Applying What Youve Learned. Comparing wage data....Ch. 14.1 - Applying What Youve Learned. Comparing wage data....Ch. 14.1 - Prob. 22ECh. 14.1 - Prob. 23ECh. 14.1 - Prob. 24ECh. 14.1 - Prob. 25ECh. 14.1 - For Exercises 23 26, use the four graphs of the...Ch. 14.1 - Applying What Youve Learned. Comparing training...Ch. 14.1 - Applying What Youve Learned. Comparing weight-loss...Ch. 14.1 - Applying What Youve Learned. Super Bowl scores....Ch. 14.1 - Applying What Youve Learned. Law School Aptitude...Ch. 14.1 - In Exercises 31 34, first group the data using an...Ch. 14.1 - Applying What Youve Learned. In Exercises 31 34,...Ch. 14.1 - In Exercises 31 34, first group the data using an...Ch. 14.1 - Applying What Youve Learned. In Exercises 31 34,...Ch. 14.1 - Communicating Mathematics What is the difference...Ch. 14.1 - Communicating Mathematics If you are using a bar...Ch. 14.1 - Communicating Mathematics What is the difference...Ch. 14.1 - Communicating Mathematics What do you see as an...Ch. 14.1 - Challenge Yourself How might you present three...Ch. 14.1 - Challenge Yourself 42. The following table is an...Ch. 14.2 - Prob. 1ECh. 14.2 - Prob. 2ECh. 14.2 - Sharpening Your Skills Find the mean, median, and...Ch. 14.2 - Prob. 4ECh. 14.2 - Prob. 5ECh. 14.2 - Prob. 6ECh. 14.2 - Prob. 7ECh. 14.2 - Prob. 8ECh. 14.2 - Prob. 9ECh. 14.2 - Prob. 10ECh. 14.2 - Prob. 11ECh. 14.2 - Prob. 12ECh. 14.2 - Prob. 13ECh. 14.2 - Prob. 14ECh. 14.2 - Prob. 15ECh. 14.2 - Prob. 16ECh. 14.2 - In Exercises 1720, a give the five-number summary...Ch. 14.2 - Prob. 18ECh. 14.2 - In Exercises 1720, a give the five-number summary...Ch. 14.2 - In Exercises 1720, a give the five-number summary...Ch. 14.2 - In Exercises 2128, find the mean, median, and mode...Ch. 14.2 - In Exercises 2128, find the mean, median, and mode...Ch. 14.2 - In Exercises 2128, find the mean, median, and mode...Ch. 14.2 - In Exercises 2128, find the mean, median, and mode...Ch. 14.2 - In Exercises 2128, find the mean, median, and mode...Ch. 14.2 - In Exercises 2128, find the mean, median, and mode...Ch. 14.2 - In Exercises 2128, find the mean, median, and mode...Ch. 14.2 - In Exercises 2128, find the mean, median, and mode...Ch. 14.2 - Many colleges assign numerical points to grades as...Ch. 14.2 - Prob. 30ECh. 14.2 - Exam scores. Izzy had an 84 and an 86 on his first...Ch. 14.2 - Prob. 32ECh. 14.2 - Prob. 33ECh. 14.2 - Prob. 34ECh. 14.2 - Exam scores. Assume that in your History of Film...Ch. 14.2 - Prob. 36ECh. 14.2 - Prob. 37ECh. 14.2 - Prob. 38ECh. 14.2 - Prob. 39ECh. 14.2 - Example 6 Using Stem-and-Leaf Home Run Records...Ch. 14.2 - Prob. 41ECh. 14.2 - Prob. 42ECh. 14.2 - Prob. 43ECh. 14.2 - Prob. 44ECh. 14.2 - Prob. 45ECh. 14.2 - Prob. 46ECh. 14.2 - Prob. 47ECh. 14.2 - A college placement office has made a comparative...Ch. 14.2 - Prob. 49ECh. 14.2 - Prob. 50ECh. 14.2 - Give three separate real-life examples in which...Ch. 14.2 - Which measure of central tendency do you think is...Ch. 14.2 - Manipulating data. Choose some set of data...Ch. 14.2 - Analyzing misleading graphs. Find a graph in the...Ch. 14.2 - Prob. 55ECh. 14.2 - Prob. 56ECh. 14.2 - Prob. 57ECh. 14.2 - Prob. 58ECh. 14.2 - Prob. 59ECh. 14.2 - Prob. 60ECh. 14.2 - Prob. 61ECh. 14.2 - Prob. 62ECh. 14.2 - Prob. 63ECh. 14.2 - Prob. 64ECh. 14.2 - Prob. 65ECh. 14.3 - Sharpening Your Skills Find the range, mean, and...Ch. 14.3 - Sharpening Your Skills Find the range, mean, and...Ch. 14.3 - Sharpening Your Skills Find the range, mean, and...Ch. 14.3 - Sharpening Your Skills Find the range, mean, and...Ch. 14.3 - Sharpening Your Skills Find the range, mean, and...Ch. 14.3 - Sharpening Your Skills Find the range, mean, and...Ch. 14.3 - Sharpening Your Skills Find the range, mean, and...Ch. 14.3 - Sharpening Your Skills Find the range, mean, and...Ch. 14.3 - Prob. 9ECh. 14.3 - Prob. 10ECh. 14.3 - Prob. 11ECh. 14.3 - Prob. 12ECh. 14.3 - Prob. 13ECh. 14.3 - Prob. 14ECh. 14.3 - Prob. 15ECh. 14.3 - Prob. 16ECh. 14.3 - Prob. 17ECh. 14.3 - Prob. 18ECh. 14.3 - Prob. 19ECh. 14.3 - Applying What Youve Learned Summarizing age data....Ch. 14.3 - Prob. 21ECh. 14.3 - Prob. 22ECh. 14.3 - Prob. 23ECh. 14.3 - Prob. 24ECh. 14.3 - Prob. 25ECh. 14.3 - Prob. 26ECh. 14.3 - Prob. 27ECh. 14.3 - Prob. 28ECh. 14.3 - Prob. 29ECh. 14.3 - Prob. 30ECh. 14.3 - In Exercises 31 and 32, we present information on...Ch. 14.3 - In Exercises 31 and 32, we present information on...Ch. 14.3 - Human resources. As the manager of the human...Ch. 14.3 - Prob. 34ECh. 14.3 - Prob. 35ECh. 14.3 - Prob. 36ECh. 14.3 - Prob. 37ECh. 14.3 - Prob. 38ECh. 14.3 - Laptop batteries. A particular brand of laptop was...Ch. 14.3 - Study times. A group of students were sampled with...Ch. 14.3 - Prob. 41ECh. 14.3 - Prob. 42ECh. 14.3 - Prob. 43ECh. 14.3 - Use the following graphs for Exercise 44 a. Which...Ch. 14.3 - Prob. 45ECh. 14.3 - Prob. 46ECh. 14.3 - Prob. 47ECh. 14.3 - Prob. 48ECh. 14.4 - Assume that the distribution in Exercises 1 6 has...Ch. 14.4 - Assume that the distribution in Exercises 1 6 has...Ch. 14.4 - Assume that the distribution in Exercises 1 6 has...Ch. 14.4 - Assume that the distribution in Exercises 1 6 has...Ch. 14.4 - Assume that the distribution in Exercises 1 6 has...Ch. 14.4 - Assume that the distribution in Exercises 1 6 has...Ch. 14.4 - Assume that the distribution in Exercises 7 12...Ch. 14.4 - Assume that the distribution in Exercises 7 12...Ch. 14.4 - Assume that the distribution in Exercises 7 12...Ch. 14.4 - Assume that the distribution in Exercises 7 12...Ch. 14.4 - Assume that the distribution in Exercises 7 12...Ch. 14.4 - Assume that the distribution in Exercises 7 12...Ch. 14.4 - Use the following graph of the standard normal...Ch. 14.4 - Use the following graph of the standard normal...Ch. 14.4 - Use Table 14.19 to find the percent of the area...Ch. 14.4 - Use Table 14.19 to find the percent of the area...Ch. 14.4 - Use Table 14.19 to find the percent of the area...Ch. 14.4 - Prob. 18ECh. 14.4 - Prob. 19ECh. 14.4 - Prob. 20ECh. 14.4 - Prob. 21ECh. 14.4 - Prob. 22ECh. 14.4 - Use Table 14.19 to find the percent of the area...Ch. 14.4 - Prob. 24ECh. 14.4 - Use Table 14.19 to find the percent of the area...Ch. 14.4 - Use Table 14.19 to find the percent of the area...Ch. 14.4 - Use Table 14.19 to find the percent of the area...Ch. 14.4 - Prob. 28ECh. 14.4 - Use Table 14.19 to find the percent of the area...Ch. 14.4 - Prob. 30ECh. 14.4 - Use Table 14.19 to find the percent of the area...Ch. 14.4 - Prob. 32ECh. 14.4 - Use Table 14.19 to find the percent of the area...Ch. 14.4 - Prob. 34ECh. 14.4 - Prob. 35ECh. 14.4 - In Exercises 35 - 40, we give you a mean, a...Ch. 14.4 - Prob. 37ECh. 14.4 - Prob. 38ECh. 14.4 - Prob. 39ECh. 14.4 - Prob. 40ECh. 14.4 - Prob. 41ECh. 14.4 - In Exercises 41 - 46, we give you a mean, a...Ch. 14.4 - Prob. 43ECh. 14.4 - Prob. 44ECh. 14.4 - Prob. 45ECh. 14.4 - Prob. 46ECh. 14.4 - Prob. 47ECh. 14.4 - Prob. 48ECh. 14.4 - Prob. 49ECh. 14.4 - Prob. 50ECh. 14.4 - Prob. 51ECh. 14.4 - Prob. 52ECh. 14.4 - Prob. 53ECh. 14.4 - Prob. 54ECh. 14.4 - Prob. 55ECh. 14.4 - Prob. 56ECh. 14.4 - Prob. 57ECh. 14.4 - Prob. 58ECh. 14.4 - Prob. 59ECh. 14.4 - Prob. 60ECh. 14.4 - Prob. 61ECh. 14.4 - Prob. 62ECh. 14.4 - Prob. 63ECh. 14.4 - Weight lifting.In a power lifting competition the...Ch. 14.4 - Strength of cables.A certain type of cable has a...Ch. 14.4 - Prob. 66ECh. 14.4 - Prob. 67ECh. 14.4 - Prob. 68ECh. 14.4 - Prob. 69ECh. 14.4 - Prob. 70ECh. 14.4 - Prob. 71ECh. 14.4 - Prob. 72ECh. 14.4 - Prob. 73ECh. 14.4 - Prob. 74ECh. 14.4 - Analyzing the SATs. Assume that the math SAT...Ch. 14.4 - Prob. 76ECh. 14.4 - Prob. 77ECh. 14.4 - Prob. 78ECh. 14.4 - Prob. 79ECh. 14.4 - Prob. 80ECh. 14.4 - Prob. 81ECh. 14.4 - Prob. 82ECh. 14.4 - Prob. 83ECh. 14.4 - Prob. 84ECh. 14.4 - Prob. 85ECh. 14.4 - Prob. 86ECh. 14.4 - If a distribution has a mean of 40 and a standard...Ch. 14.4 - Prob. 88ECh. 14.4 - Prob. 89ECh. 14.4 - Prob. 90ECh. 14.5 - In Exercises 1 and 2, state what kind of...Ch. 14.5 - In Exercises 1 and 2, state what kind of...Ch. 14.5 - For Exercises 3 6, do the following: a. Plot the...Ch. 14.5 - Prob. 4ECh. 14.5 - Prob. 5ECh. 14.5 - Prob. 6ECh. 14.5 - Prob. 7ECh. 14.5 - Prob. 8ECh. 14.5 - Prob. 9ECh. 14.5 - Prob. 10ECh. 14.5 - Prob. 11ECh. 14.5 - Prob. 12ECh. 14.5 - In Exercises 11 14, find the line of best fit for...Ch. 14.5 - Prob. 14ECh. 14.5 - Prob. 15ECh. 14.5 - Prob. 16ECh. 14.5 - Prob. 17ECh. 14.5 - Prob. 18ECh. 14.5 - In Exercises 19 22, find the line of best fit for...Ch. 14.5 - In Exercises 19 22, find the line of best fit for...Ch. 14.5 - In Exercises 19 22, find the line of best fit for...Ch. 14.5 - In Exercises 19 22, find the line of best fit for...Ch. 14.5 - In Example 3, we found the absolute value of the...Ch. 14.5 - Prob. 24ECh. 14.5 - Prob. 25ECh. 14.5 - Prob. 26ECh. 14.5 - Prob. 27ECh. 14.CR - Prob. 1CRCh. 14.CR - Prob. 2CRCh. 14.CR - Prob. 3CRCh. 14.CR - Prob. 4CRCh. 14.CR - The lists represent the ages of actors M and...Ch. 14.CR - Prob. 6CRCh. 14.CR - Prob. 7CRCh. 14.CR - Prob. 8CRCh. 14.CR - Prob. 9CRCh. 14.CR - Prob. 10CRCh. 14.CR - Prob. 11CRCh. 14.CR - Prob. 12CRCh. 14.CR - Prob. 13CRCh. 14.CR - Prob. 14CRCh. 14.CR - Prob. 15CRCh. 14.CR - Prob. 16CRCh. 14.CR - Prob. 17CRCh. 14.CR - State what kind of correlation, if any, is...Ch. 14.CR - Prob. 19CRCh. 14.CT - Prob. 1CTCh. 14.CT - Prob. 2CTCh. 14.CT - Prob. 3CTCh. 14.CT - Prob. 4CTCh. 14.CT - Prob. 5CTCh. 14.CT - Prob. 6CTCh. 14.CT - Prob. 7CTCh. 14.CT - Prob. 8CTCh. 14.CT - Prob. 9CTCh. 14.CT - Prob. 10CTCh. 14.CT - Prob. 11CTCh. 14.CT - Prob. 12CTCh. 14.CT - Prob. 13CTCh. 14.CT - Prob. 14CTCh. 14.CT - Prob. 15CTCh. 14.CT - Prob. 16CTCh. 14.CT - Prob. 17CTCh. 14.CT - Prob. 18CT
Knowledge Booster


Learn more about
Need a deep-dive on the concept behind this application? Look no further. Learn more about this topic, subject and related others by exploring similar questions and additional content below.Similar questions
- please show all the workarrow_forwardQuestions An insurance company's cumulative incurred claims for the last 5 accident years are given in the following table: Development Year Accident Year 0 2018 1 2 3 4 245 267 274 289 292 2019 255 276 288 294 2020 265 283 292 2021 263 278 2022 271 It can be assumed that claims are fully run off after 4 years. The premiums received for each year are: Accident Year Premium 2018 306 2019 312 2020 318 2021 326 2022 330 You do not need to make any allowance for inflation. 1. (a) Calculate the reserve at the end of 2022 using the basic chain ladder method. (b) Calculate the reserve at the end of 2022 using the Bornhuetter-Ferguson method. 2. Comment on the differences in the reserves produced by the methods in Part 1.arrow_forwardA population that is uniformly distributed between a=0and b=10 is given in sample sizes 50( ), 100( ), 250( ), and 500( ). Find the sample mean and the sample standard deviations for the given data. Compare your results to the average of means for a sample of size 10, and use the empirical rules to analyze the sampling error. For each sample, also find the standard error of the mean using formula given below. Standard Error of the Mean =sigma/Root Complete the following table with the results from the sampling experiment. (Round to four decimal places as needed.) Sample Size Average of 8 Sample Means Standard Deviation of 8 Sample Means Standard Error 50 100 250 500arrow_forward
- survey of 5050 young professionals found that they spent an average of $20.5620.56 when dining out, with a standard deviation of $11.4111.41. Can you conclude statistically that the population mean is greater than $2323? Use a 95% confidence interval. Question content area bottom Part 1 The 95% confidence interval is left bracket nothing comma nothing right bracketenter your response here, enter your response here. As $2323 is ▼ of the confidence interval, we ▼ can cannot conclude that the population mean is greater than $2323. (Use ascending order. Round to four decimal places as needed.)arrow_forward1. vector projection. Assume, ER1001 and you know the following: ||||=4, 7=-0.5.7. For each of the following, explicitly compute the value. འབ (a) (b) (c) (d) answer. Explicitly compute ||y7||. Explain your answer. Explicitly compute the cosine similarity of and y. Explain your Explicitly compute (x, y). Explain your answer. Find the projection of onto y and the projection of onto .arrow_forwardA survey of 250250 young professionals found that two dash thirdstwo-thirds of them use their cell phones primarily for e-mail. Can you conclude statistically that the population proportion who use cell phones primarily for e-mail is less than 0.720.72? Use a 95% confidence interval. Question content area bottom Part 1 The 95% confidence interval is left bracket nothing comma nothing right bracket0.60820.6082, 0.72510.7251. As 0.720.72 is within the limits of the confidence interval, we cannot conclude that the population proportion is less than 0.720.72. (Use ascending order. Round to four decimal places as needed.)arrow_forward
- The numbered disks shown are placed in a box and one disk is selected at random. Find the probability of selecting a 4, given that a green disk is selected. Find the probability of selecting a 4, given that a green disk is selected. (Type an integer or a simplified fraction.) green blue green green green blue green bluearrow_forwardPls help ASAParrow_forwardThe table shows the distribution, by age, of a random sample of 3160 moviegoers ages 12-74. If one moviegoer is randomly selected from this population, find the probability, expressed as a simplified fraction, that the moviegoer is not in the 65-74 age range. The probability is (Type an integer or a simplified fraction.) Age Distribution of Moviegoers Ages Number 12-24 1090 25-44 860 45-64 890 65-74 320arrow_forward
- Use the spinner shown. It is equally probable that the pointer will land on any one of the six regions. If the pointer lands on a borderline, spin again. If the pointer is spun twice, find the probability that it will land on yellow and then yellow. Find the probability that the spinner will land on yellow and then yellow. The probability is (Type an integer or a simplified fraction.) Green Red Gray Red Blue Yellow Q ☑arrow_forwardUse the spinner shown to answer the question. Assume that it is equally probable that the pointer will land on any one of the colored regions. If the pointer lands on a borderline, spin again. If the spinner is spun once, find the probability that the pointer lands in a region that is red or green. The probability that the pointer lands in a region that is red or green is (Type an integer or a simplified fraction.) green red green red yellow redarrow_forwardI need help with this problem and an explanation of the solution for the image described below. (Statistics: Engineering Probabilities)arrow_forward
arrow_back_ios
SEE MORE QUESTIONS
arrow_forward_ios
Recommended textbooks for you
 Big Ideas Math A Bridge To Success Algebra 1: Stu...AlgebraISBN:9781680331141Author:HOUGHTON MIFFLIN HARCOURTPublisher:Houghton Mifflin Harcourt
 Holt Mcdougal Larson Pre-algebra: Student Edition...AlgebraISBN:9780547587776Author:HOLT MCDOUGALPublisher:HOLT MCDOUGAL
 Glencoe Algebra 1, Student Edition, 9780079039897...AlgebraISBN:9780079039897Author:CarterPublisher:McGraw Hill
 College Algebra (MindTap Course List)AlgebraISBN:9781305652231Author:R. David Gustafson, Jeff HughesPublisher:Cengage Learning
Big Ideas Math A Bridge To Success Algebra 1: Stu...
Algebra
ISBN:9781680331141
Author:HOUGHTON MIFFLIN HARCOURT
Publisher:Houghton Mifflin Harcourt
Holt Mcdougal Larson Pre-algebra: Student Edition...
Algebra
ISBN:9780547587776
Author:HOLT MCDOUGAL
Publisher:HOLT MCDOUGAL
Glencoe Algebra 1, Student Edition, 9780079039897...
Algebra
ISBN:9780079039897
Author:Carter
Publisher:McGraw Hill
College Algebra (MindTap Course List)
Algebra
ISBN:9781305652231
Author:R. David Gustafson, Jeff Hughes
Publisher:Cengage Learning
Hypothesis Testing using Confidence Interval Approach; Author: BUM2413 Applied Statistics UMP;https://www.youtube.com/watch?v=Hq1l3e9pLyY;License: Standard YouTube License, CC-BY
Hypothesis Testing - Difference of Two Means - Student's -Distribution & Normal Distribution; Author: The Organic Chemistry Tutor;https://www.youtube.com/watch?v=UcZwyzwWU7o;License: Standard Youtube License