ORGANIC CHEMISTRY (LL)-W/SOLN.>CUSTOM<
10th Edition
ISBN: 9781259972348
Author: Carey
Publisher: MCG CUSTOM
expand_more
expand_more
format_list_bulleted
Concept explainers
Videos
Textbook Question
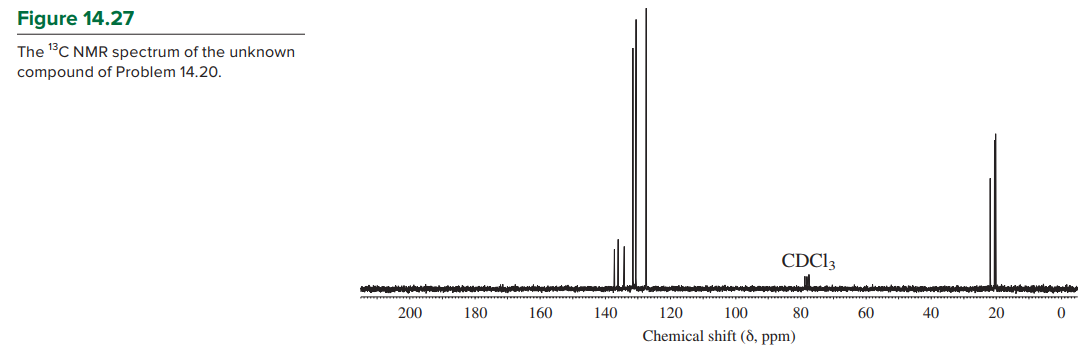
Chapter 14.16, Problem 20P
To which of the compounds of Problem
How many signals would you expect to see in the
Expert Solution & Answer
Want to see the full answer?
Check out a sample textbook solution
Students have asked these similar questions
4. Experimental Procedure.
a. How many (total) data plots are to be completed for this experiment? Account for each.
b. What information is to be extracted from each data plot?
Provide the IUPAC name of the following molecule. Don't forget to include the proper stereochemistry where appropriate.
3.
2.
1.
On the graph below, plot the volume of rain in milliliters versus its height in centimeters for the 400 mL beaker. Draw a
straight line through the points and label it "400 mL beaker."
Volume (mL)
400
350
300
250
200
150
750 mL
Florence
Volume Versus Height of Water
400 mL
beaker
100
50
0
0
2 3
4
5
Height (cm)
6 7 8 9 10
Explain why the data points for the beaker lie roughly on a straight line. What kind of relationship is this? How do you know?
(see page 276 text) the design of the beaker is a uniform cylinder
the volume of liquid increases evenly with its height
resulting in a linear relationship.
What volume would you predict for 10.0 cm of water? Explain how you arrived at your answer. Use the data table and the
graph to assist you in answering the question.
4. Plot the volume of rain in milliliters versus its height in centimeters for the 250 mL Florence flask on the same graph. Draw a
best-fit curve through the points and label it "250 mL Florence flask."
oke came
Chapter 14 Solutions
ORGANIC CHEMISTRY (LL)-W/SOLN.>CUSTOM<
Ch. 14.3 - Prob. 1PCh. 14.3 - Prob. 2PCh. 14.4 - The 1H NMR signal for bromoform (CHBr3) appears at...Ch. 14.5 - identify the most shielded and least shielded...Ch. 14.5 - (a) Assign the chemical shifts 1.6, 2.2, and 4.8...Ch. 14.5 - Assign the chemical shifts 1.1, 1.7, 2.0, and 2.3...Ch. 14.5 - Assign the chemical shifts 1.6, 4.0, 7.5, 8.2, and...Ch. 14.6 - The 300-MHz 1H NMR spectrum of 1,4-dimethylbenzene...Ch. 14.6 - Prob. 9PCh. 14.6 - How many signals would you expect to find in the...
Ch. 14.7 - Describe the appearance of the 1H NMR spectrum of...Ch. 14.8 - Describe the appearance of the 1H NMR spectrum of...Ch. 14.11 - Prob. 13PCh. 14.11 - Prob. 14PCh. 14.12 - Hydrogen bonding between the oxygen of dimethyl...Ch. 14.14 - Prob. 16PCh. 14.15 - The 13C NMR spectrum of 1-bromo-3-chloropropane...Ch. 14.15 - Consider carbons x, y, and z in p-methylanisole....Ch. 14.15 - Prob. 19PCh. 14.16 - To which of the compounds of Problem 14.16 does...Ch. 14.18 - DEPT spectra for a compound with the formula...Ch. 14.20 - Vibrational frequencies are sensitive to isotopic...Ch. 14.21 - Prob. 23PCh. 14.22 - Prob. 24PCh. 14.23 - Prob. 25PCh. 14.23 - Which one of the C5H8 isomers shown has its max at...Ch. 14.24 - Knowing what to look for with respect to isotopic...Ch. 14.24 - The base peak appears at m/z105 for one of the...Ch. 14.24 - Mass spectra of 1-bromo-4-propylbenzene and...Ch. 14.25 - Prob. 30PCh. 14 - Each of the following compounds is characterized...Ch. 14 - Deduce the structure of each of the following...Ch. 14 - From among the isomeric compounds of molecular...Ch. 14 - The H1NMR spectrum of fluorene has signals at 3.8...Ch. 14 - Prob. 35PCh. 14 - H1NMR spectra of four isomeric alcohols with...Ch. 14 - Prob. 37PCh. 14 - We noted in Section 14.13 that an NMR spectrum is...Ch. 14 - Identify each of the C4H10O isomers on the basis...Ch. 14 - A compound (C3H7ClO2) exhibited three peaks in its...Ch. 14 - Label nonequivalent carbons in the following...Ch. 14 - Compounds A and B are isomers of molecular formula...Ch. 14 - C13 NMR spectra for four isomeric alkyl bromides...Ch. 14 - Prob. 44PCh. 14 - Prob. 45PCh. 14 - Identify the C3H5Br isomers on the basis of the...Ch. 14 - Prob. 47PCh. 14 - A compound (C8H10O) has the IR and H1NMR spectra...Ch. 14 - Deduce the structure of a compound having the...Ch. 14 - Figure 14.53 presents IR, H1NMR, C13NMR and mass...Ch. 14 - H1NMR, C13NMR, IR, and mass spectra are shown for...Ch. 14 - 1H NMR and IR spectra for a compound with the...Ch. 14 - FriedelCraftsalkylation of benzene with...Ch. 14 - Prob. 54DSPCh. 14 - Prob. 55DSPCh. 14 - Prob. 56DSPCh. 14 - Prob. 57DSPCh. 14 - Prob. 58DSP
Knowledge Booster


Learn more about
Need a deep-dive on the concept behind this application? Look no further. Learn more about this topic, chemistry and related others by exploring similar questions and additional content below.Similar questions
- Show work. Don't give Ai generated solutionarrow_forwardIn the video, we looked at the absorbance of a certain substance and how it varies depending on what wavelength of light we are looking at. Below is a similar scan of a different substance. What color BEST describes how this substance will appear? Absorbance (AU) Violet Blue Green Orange 1.2 1.0- 0.8- 0.6- 0.4- 0.2 0.0 450 500 550 600 650 700 Wavelength (nm) violet indigo blue green yellow orange red Red O Cannot tell from this information In the above graph, what causes -450 nm wavelength of light to have a higher absorbance than light with a -550 nm wavelength? Check all that are true. The distance the light travels is different The different data points are for different substances The concentration is different at different times in the experiment Epsilon (molar absortivity) is different at different wavelengthsarrow_forward5. a. Data were collected for Trial 1 to determine the molar mass of a nonvolatile solid solute when dissolved in cyclo- hexane. Complete the table for the analysis (See Report Sheet). Record calculated values with the correct number of significant figures. B. Freezing Point of Cyclohexane plus Calculation Zone Unknown Solute 2. Mass of cyclohexane (g) 10.14 Part C.4 3. Mass of added solute (g) 0.255 C. Calculations 1. k; for cyclohexane (°C⚫ kg/mol) 20.0 2. Freezing point change, AT, (°C) 3.04 Part C.6 3. Mass of cyclohexane in solution (kg) 4. Moles of solute, total (mol) Show calculation. 5. Mass of solute in solution, total (g) 6. Molar mass of solute (g/mol) Show calculation.arrow_forward
- Draw and name the R groups of all 20 amino acids.arrow_forward3. Two solutions are prepared using the same solute: Solution A: 0.14 g of the solute dissolves in 15.4 g of t-butanol Solution B: 0.17 g of the solute dissolves in 12.7 g of cyclohexane Which solution has the greatest freezing point change? Show calculations and explain.arrow_forward2. Give the ground state electron configuration (e.g., 02s² σ*2s² П 2p²) for these molecules and deduce its bond order. Ground State Configuration Bond Order H2+ 02- N2arrow_forward
- 1. This experiment is more about understanding the colligative properties of a solution rather than the determination of the molar mass of a solid. a. Define colligative properties. b. Which of the following solutes has the greatest effect on the colligative properties for a given mass of pure water? Explain. (i) 0.01 mol of CaCl2 (ii) 0.01 mol of KNO3 (iii) 0.01 mol of CO(NH2)2 (an electrolyte) (an electrolyte) (a nonelectrolyte)arrow_forward5. b. For Trials 2 and 3, the molar mass of the solute was 151 g/mol and 143 g/mol respectively. a. What is the average molar mass of the solute ? b. What are the standard deviation and the relative standard deviation (%RSD) for the molar mass of the solute ?arrow_forwardShow work. Don't give Ai generated solutionarrow_forward
- 2. Explain why ice cubes formed from water of a glacier freeze at a higher temperature than ice cubes formed from water of an under- ground aquifer. Photodynamic/iStockphotoarrow_forwardShow reaction mechanism. don't give Ai generated solutionarrow_forward7. Draw the Lewis structures and molecular orbital diagrams for CO and NO. What are their bond orders? Are the molecular orbital diagrams similar to their Lewis structures? Explain. CO Lewis Structure NO Lewis Structure CO Bond Order NO Bond Order NO Molecular Orbital Diagram CO Molecular Orbital Diagramarrow_forward
arrow_back_ios
SEE MORE QUESTIONS
arrow_forward_ios
Recommended textbooks for you

 Organic ChemistryChemistryISBN:9781305580350Author:William H. Brown, Brent L. Iverson, Eric Anslyn, Christopher S. FootePublisher:Cengage Learning
 Principles of Instrumental AnalysisChemistryISBN:9781305577213Author:Douglas A. Skoog, F. James Holler, Stanley R. CrouchPublisher:Cengage Learning
Organic Chemistry
Chemistry
ISBN:9781305580350
Author:William H. Brown, Brent L. Iverson, Eric Anslyn, Christopher S. Foote
Publisher:Cengage Learning
Principles of Instrumental Analysis
Chemistry
ISBN:9781305577213
Author:Douglas A. Skoog, F. James Holler, Stanley R. Crouch
Publisher:Cengage Learning
NMR Spectroscopy; Author: Professor Dave Explains;https://www.youtube.com/watch?v=SBir5wUS3Bo;License: Standard YouTube License, CC-BY