Concept explainers
Videos
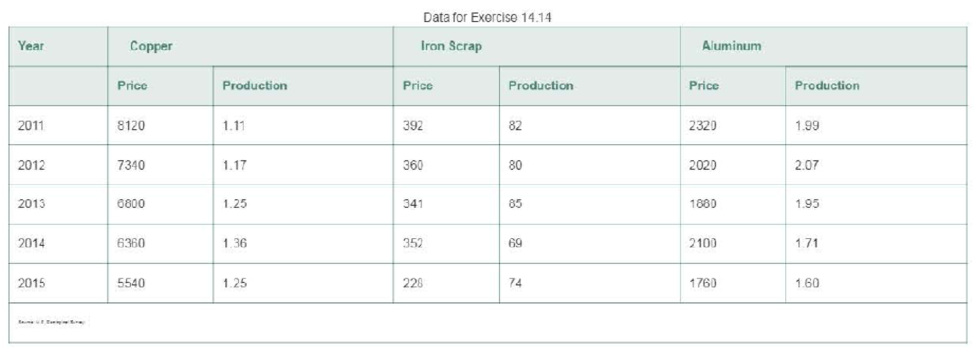
Production and price of metals. The level or price and production of metals in the United States is one measure of the strength of an industrial economy. The table at the bottom of the page lists the annual prices (in dollars per ton) and production (in millions of tons) for three metals—copper, aluminum, and iron scrap—from 2011 to 2015.
a. Compute the simple composite price and quantity indexes for the 5-year period, using 2011 as the base period.
b Compute the Laspeyres price index for the 5-year period, using 2011 as the base period.
c. Plot the simple composite and Laspeyres indexes on the same graph. Comment on the differences.
d Compute the Paasche price index for the 5-year period. using 2011 as the base period.
e. Plot the Paasche and Laspeyres indexes on the same graph. Comment on the differences.
f. Compare the Paasche and Laspeyres index values tor 2013 and 2015. Which index is more appropriate tor describing the change in this 2-year period? Explain.
Want to see the full answer?
Check out a sample textbook solution
Chapter 14 Solutions
STATISTICS F/BUS.+ECON-W/ACCESS>CUSTOM<


- Suppose that X ~Bin(n,p). Show that E[(1 - p)] = (1-p²)".arrow_forwardI need help with this problem and an explanation of the solution for the image described below. (Statistics: Engineering Probabilities)arrow_forwardI need help with this problem and an explanation of the solution for the image described below. (Statistics: Engineering Probabilities)arrow_forward
- This exercise is based on the following data on four bodybuilding supplements. (Figures shown correspond to a single serving.) Creatine(grams) L-Glutamine(grams) BCAAs(grams) Cost($) Xtend(SciVation) 0 2.5 7 1.00 Gainz(MP Hardcore) 2 3 6 1.10 Strongevity(Bill Phillips) 2.5 1 0 1.20 Muscle Physique(EAS) 2 2 0 1.00 Your personal trainer suggests that you supplement with at least 10 grams of creatine, 39 grams of L-glutamine, and 90 grams of BCAAs each week. You are thinking of combining Xtend and Gainz to provide you with the required nutrients. How many servings of each should you combine to obtain a week's supply that meets your trainer's specifications at the least cost? (If an answer does not exist, enter DNE.) servings of xtend servings of gainzarrow_forwardI need help with this problem and an explanation of the solution for the image described below. (Statistics: Engineering Probabilities)arrow_forwardI need help with this problem and an explanation of the solution for the image described below. (Statistics: Engineering Probabilities)arrow_forward
- DATA TABLE VALUES Meal Price ($) 22.78 31.90 33.89 22.77 18.04 23.29 35.28 42.38 36.88 38.55 41.68 25.73 34.19 31.75 25.24 26.32 19.57 36.57 32.97 36.83 30.17 37.29 25.37 24.71 28.79 32.83 43.00 35.23 34.76 33.06 27.73 31.89 38.47 39.42 40.72 43.92 36.51 45.25 33.51 29.17 30.54 26.74 37.93arrow_forwardI need help with this problem and an explanation of the solution for the image described below. (Statistics: Engineering Probabilities)arrow_forwardSales personnel for Skillings Distributors submit weekly reports listing the customer contacts made during the week. A sample of 65 weekly reports showed a sample mean of 19.5 customer contacts per week. The sample standard deviation was 5.2. Provide 90% and 95% confidence intervals for the population mean number of weekly customer contacts for the sales personnel. 90% Confidence interval, to 2 decimals: ( , ) 95% Confidence interval, to 2 decimals:arrow_forward
- A simple random sample of 40 items resulted in a sample mean of 25. The population standard deviation is 5. a. What is the standard error of the mean (to 2 decimals)? b. At 95% confidence, what is the margin of error (to 2 decimals)?arrow_forwardmean trough level of the population to be 3.7 micrograms/mL. The researcher conducts a study among 93 newly diagnosed arthritis patients and finds the mean trough to be 4.1 micrograms/mL with a standard deviation of 2.4 micrograms/mL. The researcher wants to test at the 5% level of significance if the trough is different than previously reported or not. Z statistics will be used. Complete Step 5 of hypothesis testing: Conclusion. State whether or not you would reject the null hypothesis and why. Also interpret what this means (i.e. is the mean trough different from 3.7 or noarrow_forward30% of all college students major in STEM (Science, Technology, Engineering, and Math). If 48 college students are randomly selected, find the probability thata. Exactly 12 of them major in STEM. b. At most 17 of them major in STEM. c. At least 12 of them major in STEM. d. Between 9 and 13 (including 9 and 13) of them major in STEM.arrow_forward
 Holt Mcdougal Larson Pre-algebra: Student Edition...AlgebraISBN:9780547587776Author:HOLT MCDOUGALPublisher:HOLT MCDOUGAL
 Algebra: Structure And Method, Book 1AlgebraISBN:9780395977224Author:Richard G. Brown, Mary P. Dolciani, Robert H. Sorgenfrey, William L. ColePublisher:McDougal Littell
 Trigonometry (MindTap Course List)TrigonometryISBN:9781337278461Author:Ron LarsonPublisher:Cengage Learning
