Concept explainers
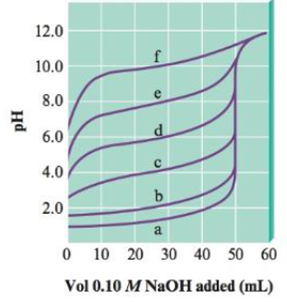
The following plot shows the pH curves for the titrations of various acids by 0.10 M NaOH (all of the acids were 50.0-mL samples of 0.10 M concentration).

a. Which pH curve corresponds to the weakest acid?
b. Which pH curve corresponds to the strongest acid? Which point on the pH curve would you examine to see if this acid is a strong acid or a weak acid (assuming you did not know the initial concentration of the acid)?
c. Which pH curve corresponds to an acid with Ka ≈ 1 × 10⁻⁶?
Trending nowThis is a popular solution!

Chapter 14 Solutions
Bundle: Chemistry: An Atoms First Approach, Loose-leaf Version, 2nd + OWLv2 with Student Solutions Manual, 4 terms (24 months) Printed Access Card
Additional Science Textbook Solutions
Physics of Everyday Phenomena
Essentials of Human Anatomy & Physiology (12th Edition)
Human Biology: Concepts and Current Issues (8th Edition)
General, Organic, and Biological Chemistry - 4th edition
- Li+ is a hard acid. With this in mind, which if the following compounds should be most soluble in water? Group of answer choices LiBr LiI LiF LiClarrow_forwardQ4: Write organic product(s) of the following reactions and show the curved-arrow mechanism of the reactions. Br MeOH OSO2CH3 MeOHarrow_forwardProvide the correct IUPAC name for the compound shown here. Reset cis- 5- trans- ☑ 4-6- 2- 1- 3- di iso tert- tri cyclo sec- oct but hept prop hex pent yl yne ene anearrow_forward
- Q6: Predict the major product(s) for the following reactions. Note the mechanism (SN1, SN2, E1 or E2) the reaction proceeds through. If no reaction takes place, indicate why. Pay attention to stereochemistry. NaCN DMF Br σ Ilm... Br H Br H H NaCN CH3OH KOtBu tBuOH NaBr H₂O LDA Et2O (CH3)2CHOH KCN DMSO NaOH H₂O, A LDA LDA Systemarrow_forwardQ7: For the following reactions, indicate the reaction conditions that would provide the indicated product in a high yield. Note the major reaction pathway that would take place (SN1, SN2, E1, or E2) Note: There may be other products that are not shown. There maybe more than one plausible pathway. Br H3C OH H3C CI ... H3C SCH2CH3 CI i SCH2CH3 ཨ་ Br System Settarrow_forwardQ2: Rank the compounds in each of the following groups in order of decreasing rate of solvolysis in aqueous acetone. OSO2CF3 OSO2CH3 OH a. b. CI Brarrow_forward
- ох 4-tert-butyl oxy cyclohex-1-ene Incorrect, 1 attempt remaining The systematic name of this compound classifies the -OR group as a substituent of the hydrocarbon, which is considered the principal functional group. The ether substituent is named with the suffix 'oxy'. The general format for the systematic name of a hydrocarbon is: [prefix/substituent] + [parent] + [functional group suffix] Substituents are listed in alphabetical order. Molecules with a chiral center will indicate the absolute configuration at the beginning of its name with the R and S notation.arrow_forward5. Compressibility (6 points total). The isothermal compressibility is a measure of how hard/easy it is to compress an object (how squishy is it?) at constant temperature. It is др defined as Br=-()=-(200²)T' (a) You might wonder why there is a negative sign in this formula. What does it mean when this quantity is positive and what does it mean when this quantity is negative? (b) Derive the formula for the isothermal compressibility of an ideal gas (it is very simple!) (c) Explain under what conditions for the ideal gas the compressibility is higher or lower, and why that makes sense.arrow_forward19. (3 pts) in Chapter 7 we will see a reaction of halocyclohexanes that requires that the halogen occupy an axial position with this in mind, would you expect cis-1-bromo-3-methylcyclohexane or trans-1-bromo-3-methylcyclohexane to be more reactive in this reaction? Briefly explain your choice using structures to support your answer. Mere-eries-cecleone) The tran-i-browse-3-methylcyclohexionearrow_forward
- Please help me calculate the undiluted samples ppm concentration. My calculations were 280.11 ppm. Please see if I did my math correctly using the following standard curve. Link: https://mnscu-my.sharepoint.com/:x:/g/personal/vi2163ss_go_minnstate_edu/EVSJL_W0qrxMkUjK2J3xMUEBHDu0UM1vPKQ-bc9HTcYXDQ?e=hVuPC4arrow_forwardProvide an IUPAC name for each of the compounds shown. (Specify (E)/(Z) stereochemistry, if relevant, for straight chain alkenes only. Pay attention to commas, dashes, etc.) H₁₂C C(CH3)3 C=C H3C CH3 CH3CH2CH CI CH3 Submit Answer Retry Entire Group 2 more group attempts remaining Previous Nextarrow_forwardArrange the following compounds / ions in increasing nucleophilicity (least to most nucleophilic) CH3NH2 CH3C=C: CH3COO 1 2 3 5 Multiple Choice 1 point 1, 2, 3 2, 1, 3 3, 1, 2 2, 3, 1 The other answers are not correct 0000arrow_forward
 Chemistry: The Molecular ScienceChemistryISBN:9781285199047Author:John W. Moore, Conrad L. StanitskiPublisher:Cengage Learning
 General Chemistry - Standalone book (MindTap Cour...ChemistryISBN:9781305580343Author:Steven D. Gammon, Ebbing, Darrell Ebbing, Steven D., Darrell; Gammon, Darrell Ebbing; Steven D. Gammon, Darrell D.; Gammon, Ebbing; Steven D. Gammon; DarrellPublisher:Cengage Learning
 Chemistry: Principles and PracticeChemistryISBN:9780534420123Author:Daniel L. Reger, Scott R. Goode, David W. Ball, Edward MercerPublisher:Cengage Learning
 Chemistry & Chemical ReactivityChemistryISBN:9781337399074Author:John C. Kotz, Paul M. Treichel, John Townsend, David TreichelPublisher:Cengage Learning


