GO Fresh water flows horizontally from pipe section 1 of cross-sectional area A 1 into pipe section 2 of cross-sectional area A 2 . Figure 14-52 gives a plot of the pressure difference p 2 − p 1 versus the inverse area squared A 1 − 2 that would be expected for a volume flow rate of a certain value if the water flow were laminar under all circumstances. The scale on the vertical axis is set by Δ p s = 300 kN/m 2 . For the conditions of the figure, what are the values of (a) A 2 and (b) the volume flow rate? Figure 14-52 Problem 68.
GO Fresh water flows horizontally from pipe section 1 of cross-sectional area A 1 into pipe section 2 of cross-sectional area A 2 . Figure 14-52 gives a plot of the pressure difference p 2 − p 1 versus the inverse area squared A 1 − 2 that would be expected for a volume flow rate of a certain value if the water flow were laminar under all circumstances. The scale on the vertical axis is set by Δ p s = 300 kN/m 2 . For the conditions of the figure, what are the values of (a) A 2 and (b) the volume flow rate? Figure 14-52 Problem 68.
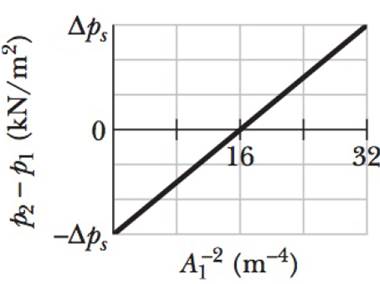
GO Fresh water flows horizontally from pipe section 1 of cross-sectional area A1 into pipe section 2 of cross-sectional area A2. Figure 14-52 gives a plot of the pressure difference p2− p1 versus the inverse area squared
A
1
−
2
that would be expected for a volume flow rate of a certain value if the water flow were laminar under all circumstances. The scale on the vertical axis is set by Δps = 300 kN/m2. For the conditions of the figure, what are the values of (a) A2 and (b) the volume flow rate?
Will you please walk me through the calculations in more detail for solving this problem? I am a bit rusty on calculus and confused about the specific steps of the derivation: https://www.bartleby.com/solution-answer/chapter-3-problem-15e-modern-physics-2nd-edition/9780805303087/7cf8c31d-9476-46d5-a5a9-b897b16fe6fc
please help with the abstract. Abstract - This document outlines the format of the lab report and describes the Excel assignment. The abstract should be a short paragraph that very briefly includes the experiment objective, method, result and conclusion. After skimming the abstract, the reader should be able to decide whether they want to keep reading your work. Both the format of the report and the error analysis are to be followed. Note that abstract is not just the introduction and conclusion combined, but rather the whole experiment in short including the results. I have attacted the theory.
Using the Experimental Acceleration due to Gravity values from each data table, Data Tables 1, 2, and 3; determine the Standard Deviation, σ, mean, μ, variance, σ2 and the 95% Margin of Error (Confidence Level) Data: Ex. Acc. 1: 12.29 m/s^2. Ex. Acc. 2: 10.86 m/s^2, Ex. Acc. 3: 9.05 m/s^2
Need a deep-dive on the concept behind this application? Look no further. Learn more about this topic, physics and related others by exploring similar questions and additional content below.


 Principles of Physics: A Calculus-Based TextPhysicsISBN:9781133104261Author:Raymond A. Serway, John W. JewettPublisher:Cengage Learning
 University Physics Volume 1PhysicsISBN:9781938168277Author:William Moebs, Samuel J. Ling, Jeff SannyPublisher:OpenStax - Rice University
 Physics for Scientists and Engineers: Foundations...PhysicsISBN:9781133939146Author:Katz, Debora M.Publisher:Cengage Learning
 College PhysicsPhysicsISBN:9781938168000Author:Paul Peter Urone, Roger HinrichsPublisher:OpenStax College
 Physics for Scientists and EngineersPhysicsISBN:9781337553278Author:Raymond A. Serway, John W. JewettPublisher:Cengage Learning
 Physics for Scientists and Engineers with Modern ...PhysicsISBN:9781337553292Author:Raymond A. Serway, John W. JewettPublisher:Cengage Learning