
1.
Prepare an interim quality cost performance report for the year 2015 that compares actual quality costs with budgeted quality costs and comment on the ability of the firm for achieving its quality goals for the year.
1.
Explanation of Solution
Quality cost performance reports: In a quality cost performance report, identification of quality standard is the main element and it has two important elements namely; actual outcomes and expected or standard outcomes.
Interim quality report: Interim quality performance report compares the actual quality at the end of the period with the budgeted costs and this report examines the progress attained within the period comparative to the planned level of progress for that period.
Prepare an interim quality cost performance report for the year 2015:
| Company I | ||||
| Interim Performance Report: Quality Costs | ||||
| For the Year Ended December 31, 2015 | ||||
| Particulars |
Actual Costs (a) |
Budgeted costs (b) |
Variance | |
| Prevention costs: | ||||
| Fixed: | ||||
| Quality planning | $150,000 | $150,000 | $0 | |
| Quality training | $20,000 | $20,000 | $0 | |
| Quality improvement | $100,000 | $80,000 | $20,000 | U |
| Quality reporting | $12,000 | $10,000 | $2,000 | U |
| Total prevention costs | $282,000 | 260,000 | $22,000 | U |
| Appraisal costs: | ||||
| Variable: | ||||
| Proofreading | $520,000 | $500,000 | $20,000 | U |
| Other inspection | $60,000 | $50,000 | $10,000 | U |
| Total appraisal costs | $580,000 | 550,000 | $30,000 | U |
| Failure costs: | ||||
| Variable: | ||||
| Correction of typos | $165,000 | $150,000 | $15,000 | U |
| Rework | $76,000 | $75,000 | $1,000 | U |
| Plate revisions | $58,000 | $55,000 | $3,000 | U |
| Press downtime | $102,000 | $100,000 | $2,000 | U |
| Waste | $ 136,000 | $130,000 | $ 6,000 | U |
| Total failure costs | $537,000 | $510,000 | $27,000 | U |
| Total quality costs | $1,399,000 | $1,320,000 | $79,000 | U |
Table (1)
Every single category and each individual item are equivalent to or higher than the budgeted amounts. Therefore, the firm cannot achieve its budgeted goals for the year.
2.
Prepare a one-period quality performance report for 2015 that compares the actual quality costs of 2014 with the actual costs of 2015 and state the amount of change in profit due to improvement in quality.
2.
Explanation of Solution
Prepare a one-period quality performance report for 2015:
| Company I | ||||
| Performance Report: Quality Costs | ||||
| One-Year Trend | ||||
| For the Year Ended December 31, 2015 | ||||
| Particulars |
Actual Costs 2015 (a) |
Actual Costs 2014 (b) |
Variance | |
| Prevention costs: | ||||
| Fixed: | ||||
| Quality planning | $150,000 | $140,000 | ($10,000) | U |
| Quality training | $20,000 | $20,000 | $0 | |
| Quality improvement | $100,000 | $120,000 | $20,000 | F |
| Quality reporting | $12,000 | $12,000 | $0 | |
| Total prevention costs | $282,000 | $292,000 | $10,000 | F |
| Appraisal costs: | ||||
| Variable: | ||||
| Proofreading | $520,000 | $580,000 | $60,000 | F |
| Other inspection | $60,000 | $80,000 | $20,000 | F |
| Total appraisal costs | $580,000 | $660,000 | $80,000 | F |
| Failure costs: | ||||
| Variable: | ||||
| Correction of typos | $165,000 | $200,000 | $35,000 | F |
| Rework | $76,000 | $131,000 | $55,000 | F |
| Plate revisions | $58,000 | $83,000 | $25,000 | F |
| Press downtime | $102,000 | $123,000 | $21,000 | F |
| Waste | $ 136,000 | $191,000 | $ 55,000 | F |
| Total failure costs | $537,000 | $728,000 | $191,000 | F |
| Total quality costs | $1,399,000 | $1,680,000 | $281,000 | F |
Table (2)
- The quality cost reduced from 2014 to 2015; therefore, the profit increased to $281,000. There is still considerable improvement even though the budgeted reductions for the year are not met.
- Additionally, the improvement was due to the “reduction of failure costs” which is a positive sign denoting that quality is certainly increasing.
3.
Prepare a graph that shows the trend in total quality costs as a percentage of sales since the inception of the quality improvement program.
3.
Explanation of Solution
Multiple-period quality trend reports: Multiple-period quality trend reports is a chart or graph that tracks the change in quality from the starting of the program to the present.
Prepare a graph:
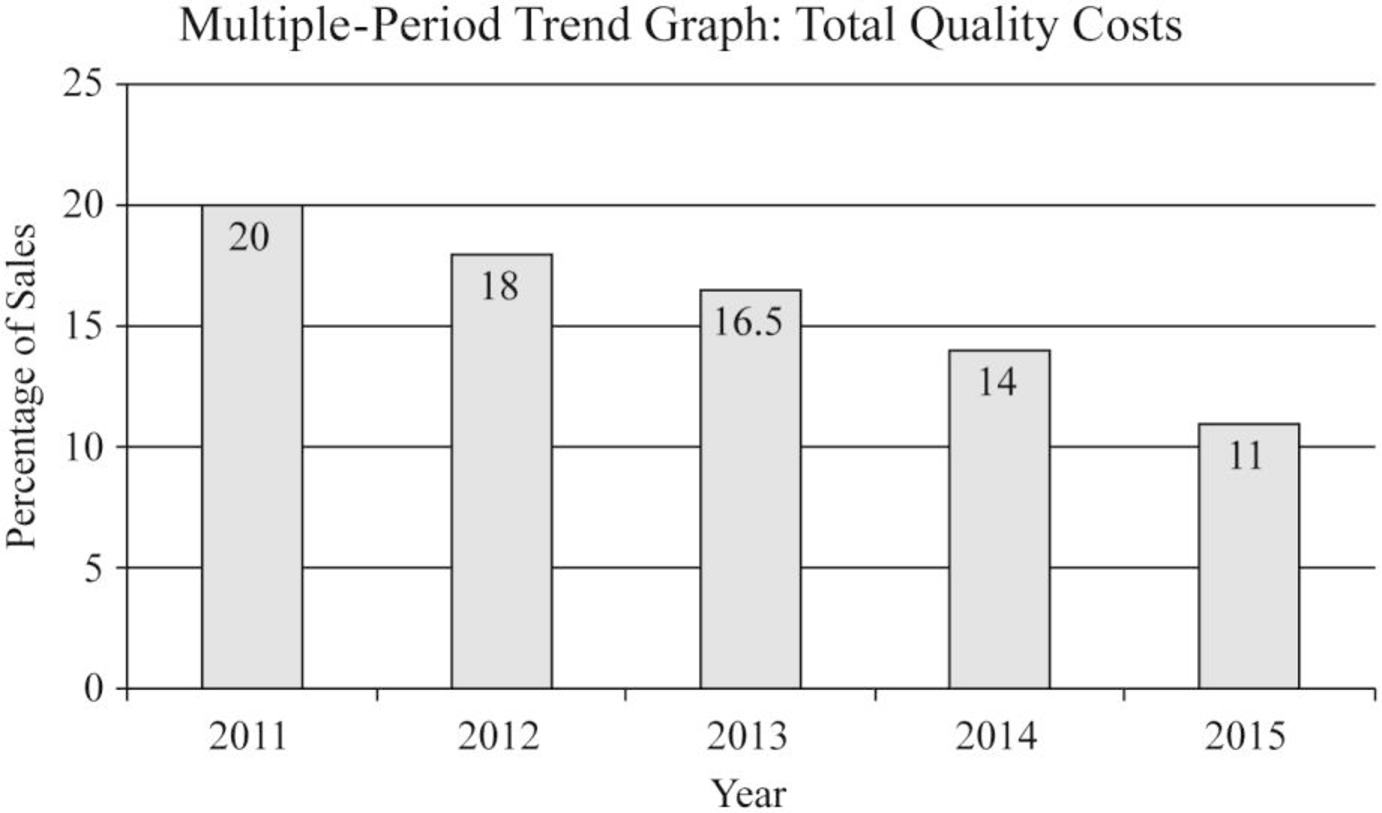
Figure (1)
Working notes:
(1)Calculate the percent of sales:
| Year |
Quality Costs (a) |
Sales Revenues (b) |
Percent of sales |
| 2011 | $2,000,000 | $10,000,000 | 20% |
| 2012 | $1,800,000 | $10,000,000 | 18% |
| 2013 | $1,815,000 | $11,000,000 | 16.5% |
| 2014 | $1,680,000 | $12,000,000 | 14% |
| 2015 | $1,320,000 | $12,000,000 | 11.65% |
Table (3)
4.
Prepare a graph that shows the trend for all four quality cost categories for 2011 through 2015 and state the manner in which the graphs helps management to know that the reduction in total quality costs is attributable to quality improvement.
4.
Explanation of Solution
Prepare a graph:
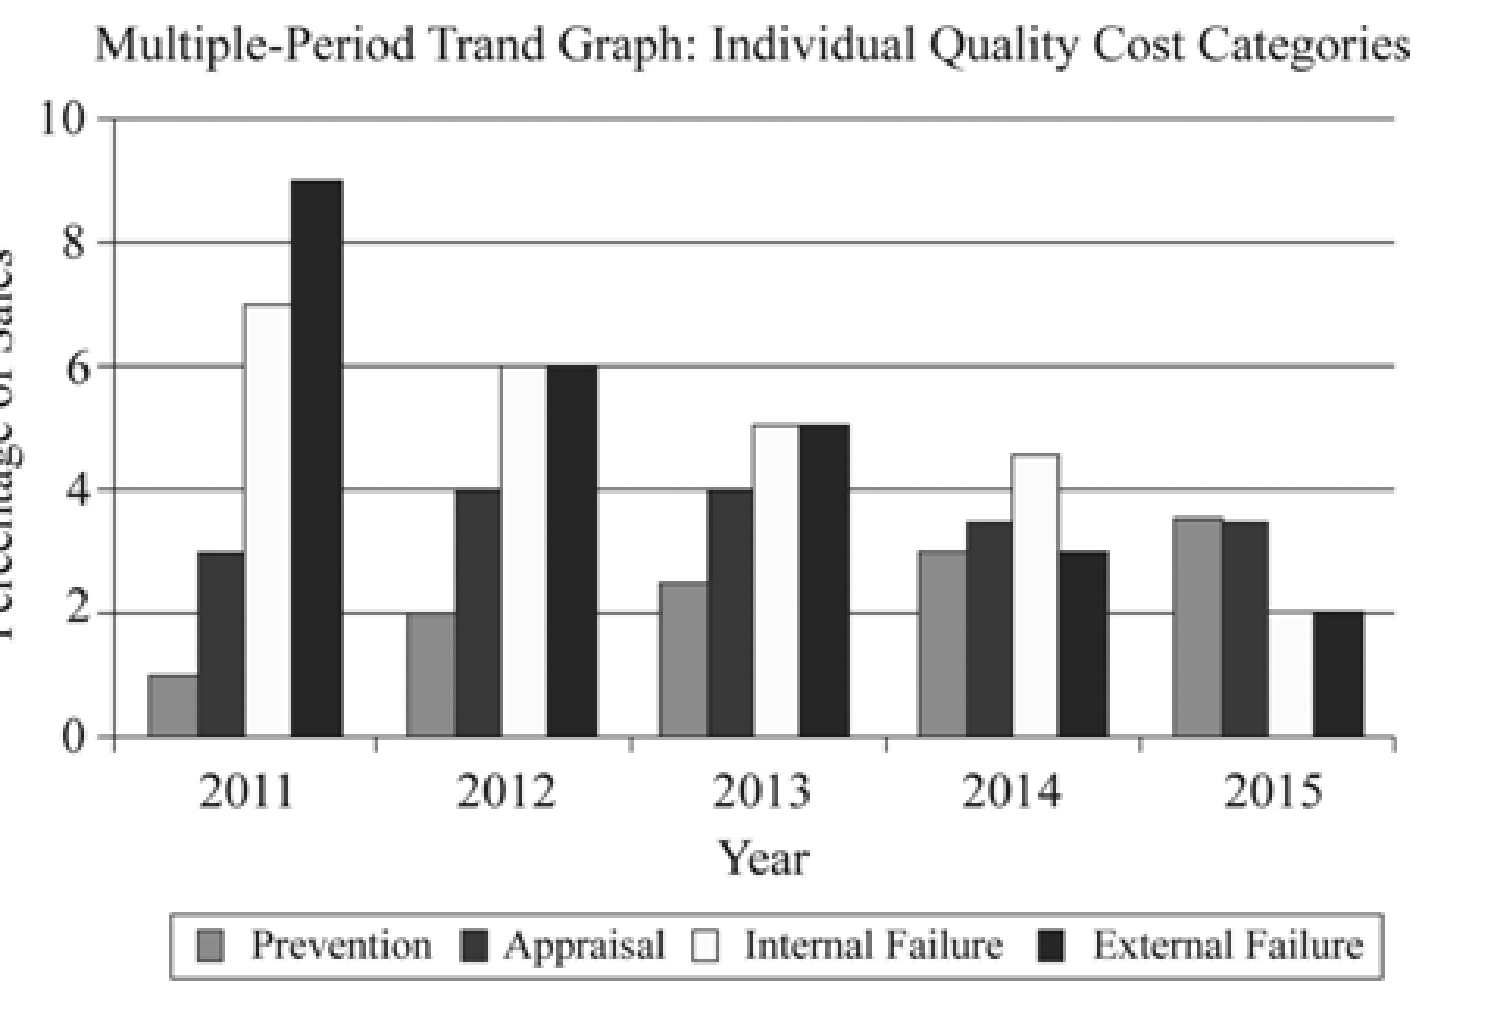
Figure (2)
“Increases in prevention and appraisal costs” along with simultaneous decrease in failure costs are good indication that in general quality is increasing. It is to be noted, that decreases in external failure costs are mostly difficult to attain without increase in actual quality.
5.
Prepare a long-range quality cost performance report.
5.
Explanation of Solution
Long-range performance report: Long-range performance report compares the “current actual” with the costs that will be allowed if the “zero-defects standard” is being met by assuming that sales level is equal to that of the existing period.
Prepare a long-range quality cost performance report:
| Company I | ||||
| Performance Report: Quality Costs | ||||
| One-Year Trend | ||||
| For the Year Ended December 31, 2015 | ||||
| Particulars |
Actual Costs 2015 (a) |
Long-Range Target Costs (b) |
Variance | |
| Prevention costs: | ||||
| Fixed: | ||||
| Quality planning | $150,000 | $0 | $150,000 | U |
| Quality training | $20,000 | (9)$112,500 | ($92,500) | F |
| Quality improvement | $100,000 | $0 | $100,000 | U |
| Quality reporting | $12,000 | (10)$26,250 | ( $14,250) | F |
| Total prevention costs | $282,000 | $138,750 | $143,250 | U |
| Appraisal costs: | ||||
| Variable: | ||||
| Proofreading | (2)$650,000 | (11)$187,500 | $462,500 | U |
| Other inspection | (3) $75,000 | (12)$48,750 | $26,250 | U |
| Total appraisal costs | $725,000 | $236,250 | $488,750 | U |
| Failure costs: | ||||
| Variable: | ||||
| Correction of typos | (4)$206,250 | $0 | $206,250 | U |
| Rework | (5)$95,000 | $0 | $95,000 | U |
| Plate revisions | (6)$72,500 | $0 | $72,500 | U |
| Press downtime | (7)$127,500 | $0 | $127,500 | U |
| Waste | (8) $170,000 | $0 | $170,000 | U |
| Total failure costs | $671,250 | $0 | $671,250 | U |
| Total quality costs | $1,678,250 | $375,000 | $1,303,250 | U |
Table (4)
Note: Apart from for prevention costs, which is a fixed cost, actual costs of 2015, are adjusted to a sales level of $15 million.
Workings notes:
(2)Calculate the proofreading costs:
(3)Calculate the other inspection costs:
(4)Calculate the correction of typos costs:
(5)Calculate the rework costs:
(6)Calculate the plate revision costs:
(7)Calculate the press downtime costs:
(8)Calculate the cost of waste:
(9)Calculate the long-range target costs for quality training:
(10)Calculate the long-range target costs for quality reporting:
(11)Calculate the long-range target costs for proofreading:
(12)Calculate the long-range target costs for other inspection:
(13)Calculate the amount of total quality costs:
Want to see more full solutions like this?
Chapter 14 Solutions
EBK CORNERSTONES OF COST MANAGEMENT

- Can you demonstrate the accurate method for solving this financial accounting question?arrow_forwardI need assistance with this general accounting question using appropriate principles.arrow_forwardI am searching for the correct answer to this general accounting problem with proper accounting rules.arrow_forward
- Help with accountingarrow_forwardJob 786 was one of the many jobs started and completed during the year. The job required $8,400 in direct materials and 35 hours of direct labor time at a total direct labor cost of $9,300. If the job contained five units and the company billed at 70% above the unit product cost on the job cost sheet, what price per unit would have been charged to the customer?arrow_forwardI am looking for the correct answer to this general accounting question with appropriate explanations.arrow_forward
- I need help with this financial accounting question using standard accounting techniques.arrow_forwardI am searching for the accurate solution to this general accounting problem with the right approach.arrow_forwardI am looking for a step-by-step explanation of this financial accounting problem with correct standards.arrow_forward
 Cornerstones of Cost Management (Cornerstones Ser...AccountingISBN:9781305970663Author:Don R. Hansen, Maryanne M. MowenPublisher:Cengage Learning