1.
Calculate the relative distribution of quality costs for each year and prepare a pie chart and find out whether the company is moving in a right direction in terms of the balance among the quality cost management.
1.
Explanation of Solution
Total Quality Management: Total Quality Management is a method that eliminates wasteful activities and improves quality throughout the value chain by allocating quality management responsibility, rewarding low-cost, high-quality results and monitoring quality costs.
Quality costs: Quality costs are costs that are incurred to avoid, identify and eliminate defects from products. Quality costs are classified into four components namely;
- 1. “Prevention costs”.
- 2. “Appraisal costs”.
- 3. “Internal failure costs”.
- 4. “External failure costs”.
For the year 2014:
Calculate the cost-to-sales ratio for appraisal cost:
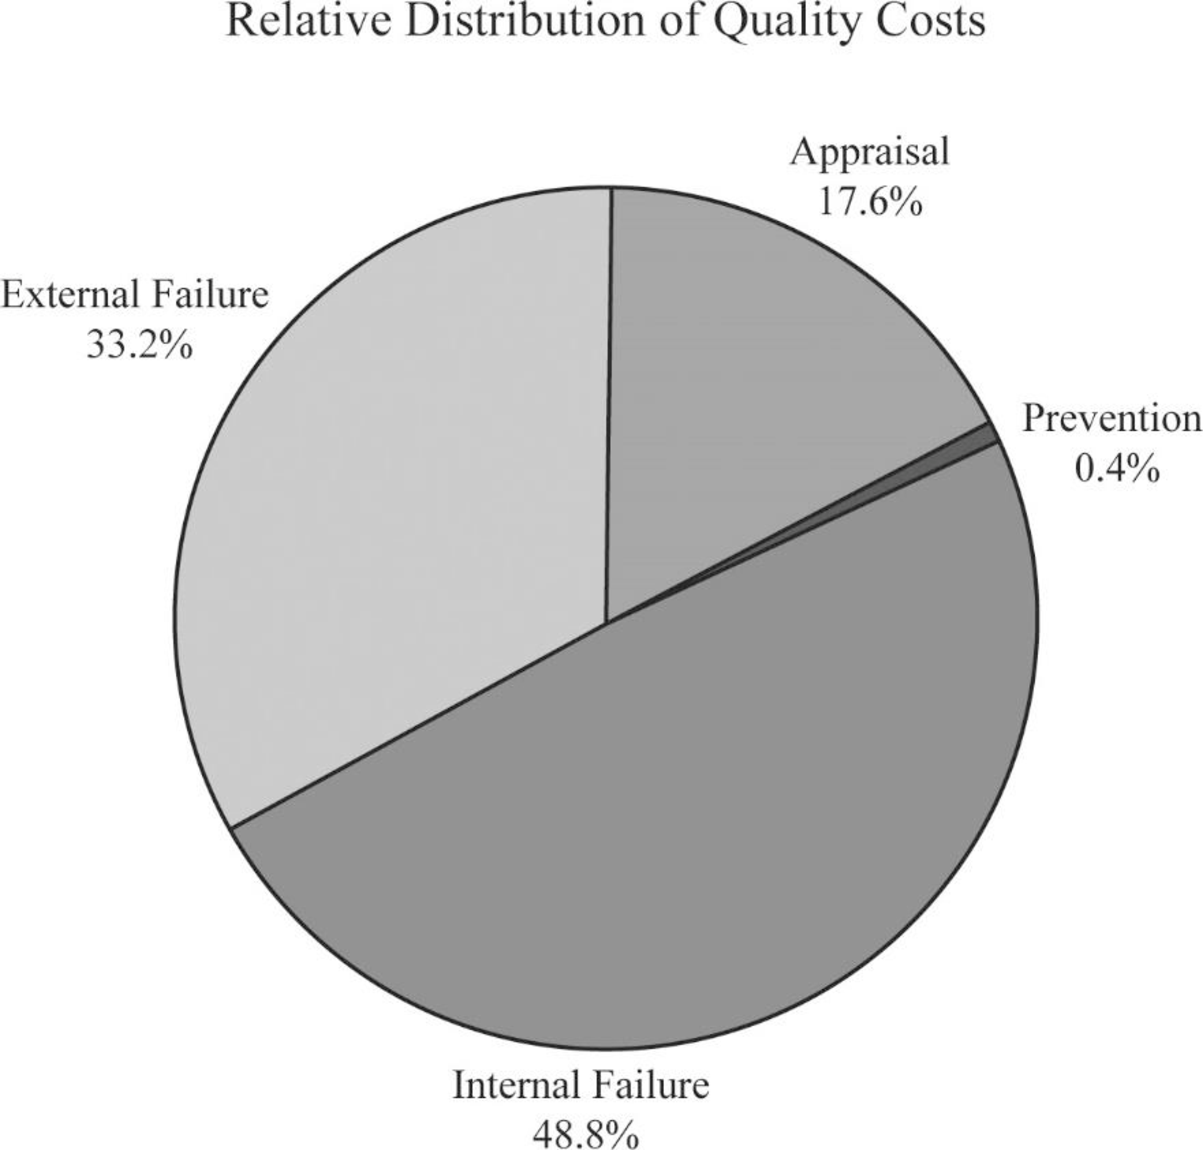
Therefore, the cost-to-sales ratio for appraisal cost is 17.6%.
Calculate the cost-to-sales ratio for prevention cost:
Therefore, the cost-to-sales ratio for prevention cost is 0.4%.
Calculate the cost-to-sales ratio for internal failure cost:
Therefore, the cost-to-sales ratio for internal failure cost is 48.8%.
Calculate the cost-to-sales ratio for external failure cost:
Therefore, the cost-to-sales ratio for external failure cost is 33.2%.
Prepare pie chart for the year 2014:

Figure (1)
For the year 2015:
Calculate the cost-to-sales ratio for appraisal cost:
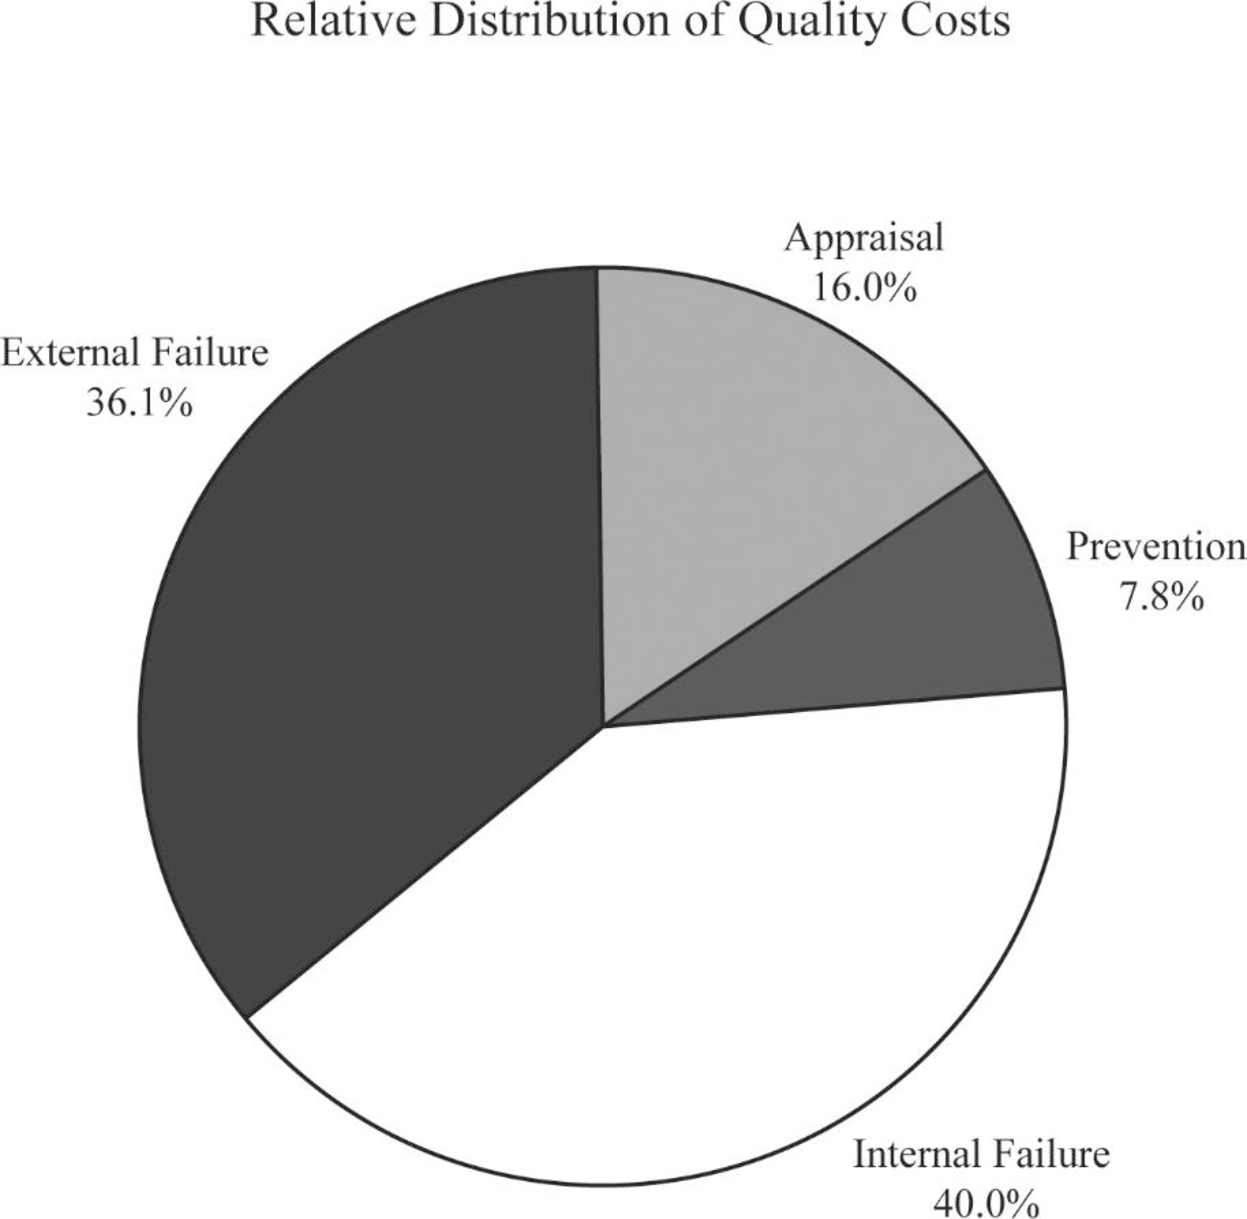
Therefore, the cost-to-sales ratio for appraisal cost is 17.6%.
Calculate the cost-to-sales ratio for prevention cost:
Therefore, the cost-to-sales ratio for prevention cost is 0.4%.
Calculate the cost-to-sales ratio for internal failure cost:
Therefore, the cost-to-sales ratio for internal failure cost is 48.8%.
Calculate the cost-to-sales ratio for external failure cost:
Therefore, the cost-to-sales ratio for external failure cost is 33.2%.
Prepare pie chart for the year 2015:

Figure (2)
Yes. Additional effort is required for “prevention and appraisal activities”. The movement is in that direction, and total failure costs is been decreased.
2.
Prepare a one-year performance report for 2015 and find out the amount of profits increased sue the quality improvements made by Company M.
2.
Explanation of Solution
Long-range performance report: Long-range performance report compares the “current actual” with the costs that will be allowed if the “zero-defects standard” is being met by assuming that sales level is equal to that of the existing period.
Prepare a one-year performance report for 2015:
| Company M | ||||
| Performance Report | ||||
| One-Year Trend | ||||
| Particulars |
Actual Costs 2015 (a) |
Actual Costs 2014 (b) |
Variance | |
| Prevention costs | ||||
| Quality circles (F) | $40,000 | $4,000 | ($36,000) | U |
| Design reviews(F) | $20,000 | $2,000 | ($18,000) | U |
| Improvement projects(F) | $100,000 | $2,000 | ($98,000) | U |
| Total prevention costs | $160,000 | $8,000 | ($152,000) | U |
| Appraisal costs: | ||||
| Packaging inspection(V) | $300,000 | (1)$400,000 | $100,000 | F |
| Product acceptance(V) | $28,000 | (2)$50,000 | $22,000 | F |
| Total appraisal costs | $328,000 | $450,000 | $122,000 | F |
| Internal failure costs: | ||||
| Scrap(V) | $240,000 | (3)$350,000 | $110,000 | F |
| Rework(V) | $320,000 | (4)$450,000 | $130,000 | F |
| Yield losses (V) | $100,000 | (5)$200,000 | $100,000 | F |
| Retesting (V) | $160,000 | (6)$250,000 | $90,000 | F |
| Total internal failure costs | $820,000 | $1,250,000 | $430,000 | F |
| External failure costs: | ||||
| Returned materials (V) | $160,000 | (7)$200,000 | $40,000 | F |
| Allowances (V) | $140,000 | (8)$150,000 | $10,000 | F |
| Warranty (V) | $440,000 | (9)$500,000 | $60,000 | F |
| Total external failure costs | $740,000 | $850,000 | $110,000 | F |
| Total quality costs | $2,048,000 | $2,558,000 | $510,000 | F |
Table (1)
For comparing the costs of 2015 with costs of 2014, the costs for 2014 should be adjusted to a sales level of $10 million. Therefore, all variable costs will vary from the 2014 levels. For instance, the adjusted product packaging inspection cost is $400,000(1).
Working notes:
(1)Calculate the actual costs of packaging inspection:
(2)Calculate the actual costs of product acceptance:
(3)Calculate the actual costs of scrap:
(4)Calculate the actual costs of rework:
(5)Calculate the actual costs of yield losses:
(6)Calculate the actual costs of retesting:
(7)Calculate the actual costs of returned materials:
(8)Calculate the actual costs of returned allowances:
(9)Calculate the actual costs of returned warranty:
3.
Estimate the additional improvement in profits if Company M reduces its quality costs to 2.5 percent of sales revenue.
3.
Explanation of Solution
Calculate the additional improvements in profits:
Therefore, the additional improvements in profits are $1,798,000.
Want to see more full solutions like this?
Chapter 14 Solutions
EBK CORNERSTONES OF COST MANAGEMENT
- Groot Co. (GC) sells $1,200,000 of 6-year, 10% bonds at par plus accrued interest. The bonds are dated January 1, 2026 but due to market conditions are not issued until May 1, 2026. Interest is payable on June 30 and December 31 each year. The market rate of interest at time of issue is the same as the stated rate. Required The issuance of the bonds on May 1, 2026. Assume that GC has adopted a policy of crediting accrued interest payable for the accrued interest on the date of sale. Payment of interest on June 30, 2026. Payment of interest on December 31, 2026.arrow_forward1. Define working capital and explain its importance in financial health and liquidity management. 2. Assess how the matching concept and accrual basis affect the reporting of current assets and liabilities. 3. Using a hypothetical balance sheet (you may create one), identify at least 5 current assets and 5 current liabilities and analyze how changes in these elements affect liquidity ratios. 4. Recommend at least two strategies VinGrenDom Ltd. can implement to optimize working capital.arrow_forwardNonearrow_forward
- No Ai Answerarrow_forwardI need the correct answer to this financial accounting problem using the standard accounting approach.arrow_forwardTheron Interiors manufactures handcrafted cabinetry and uses a process costing system. During the month of October, the company started Production on 720 units and completed 590 units. The remaining 120 units were 60% complete in terms of materials and 40% complete in terms of labor and overhead. The total cost incurred during the month was $45,000 for materials and $31,200 for labor and overhead. Using the weighted-average method, what is the equivalent unit cost for materials and conversion costs (labor and overhead)?arrow_forward
- General Accountingarrow_forwardKamala Khan has to decide between the following two options: Take out a student loan of $70,000 and study accounting full time for the next three years. The interest on the loan is 4% per year payable annually. The principle is to be paid in full after ten years. Study part time and work part time to earn $15,000 per year for the following six years. Once Kamala graduates, she estimates that she will earn $30,000 for the first three years and $40,000 the next four years. Kamala's banker says the market interest for a ten-year horizon is 6%. Required Calculate NPV of the ten-year cash flows of the two options. For simplification assume that all cash flows happen at year-end. Based on the NPV which of the two options is better for Kamala?arrow_forwardFinancial Accountingarrow_forward
 Managerial Accounting: The Cornerstone of Busines...AccountingISBN:9781337115773Author:Maryanne M. Mowen, Don R. Hansen, Dan L. HeitgerPublisher:Cengage Learning
 Cornerstones of Cost Management (Cornerstones Ser...AccountingISBN:9781305970663Author:Don R. Hansen, Maryanne M. MowenPublisher:Cengage Learning

