
Concept explainers
Videos
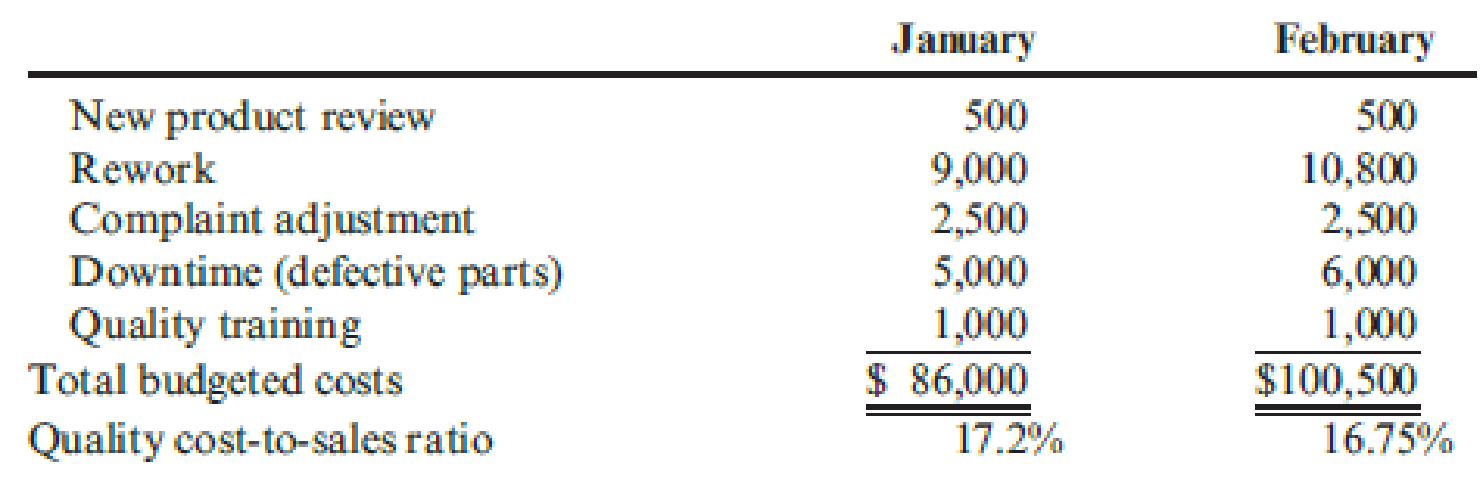
Recently, Ulrich Company received a report from an external consulting group on its quality costs. The consultants reported that the company’s quality costs total about 21 percent of its sales revenues. Somewhat shocked by the magnitude of the costs, Rob Rustin, president of Ulrich Company, decided to launch a major quality improvement program. For the coming year, management decided to reduce quality costs to 17 percent of sales revenues. Although the amount of reduction was ambitious, most company officials believed that the goal could be realized. To improve the monitoring of the quality improvement program, Rob directed Pamela Golding, the controller, to prepare monthly performance reports comparing budgeted and actual quality costs. Budgeted costs and sales for the first two months of the year are as follows:
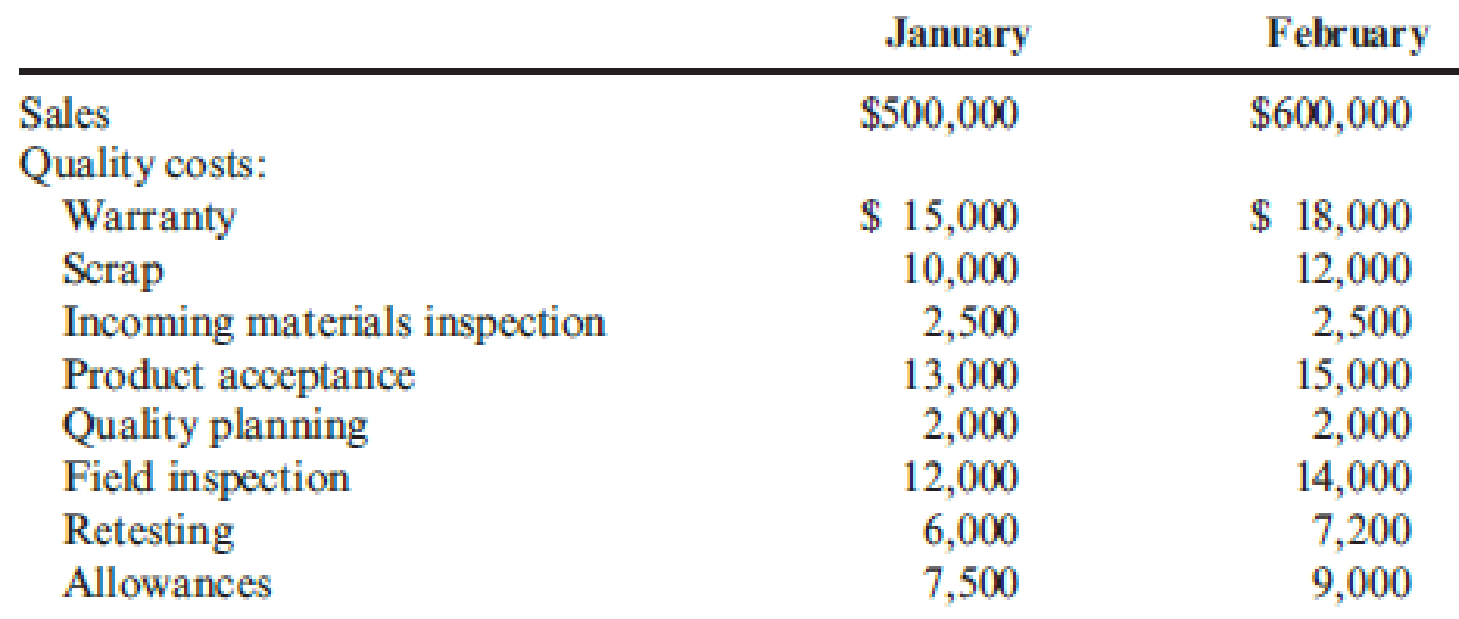
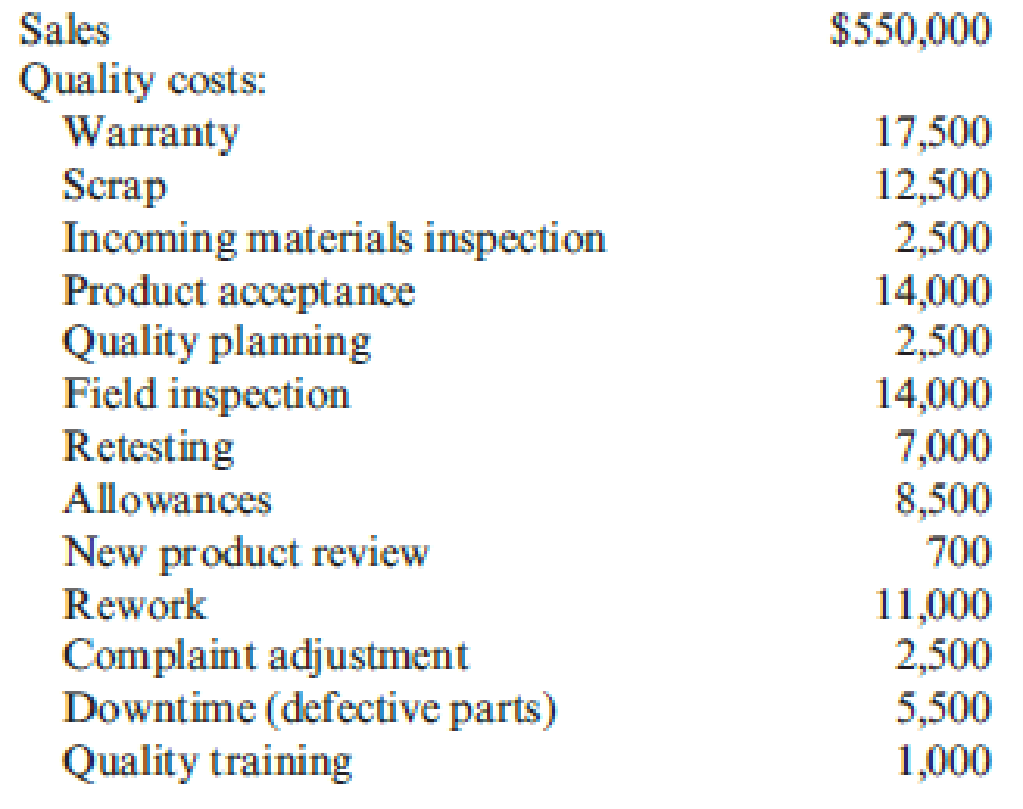
The following actual sales and actual quality costs were reported for January:
Required:
- 1. Reorganize the monthly budgets so that quality costs are grouped in one of four categories: appraisal, prevention, internal failure, or external failure. (Essentially, prepare a budgeted cost of quality report.) Also, identify each cost as variable (V) or fixed (F). (Assume that no costs are mixed.)
- 2. Prepare a performance report for January that compares actual costs with budgeted costs. Comment on the company’s progress in improving quality and reducing its quality costs.
1.
Reorganize the monthly budget, prepare a budgeted cost of quality report, and identify the type of cost as variable (V) or fixed (F).
Explanation of Solution
Quality cost performance reports: In a quality cost performance report, identification of quality standard is the main element and it has two important elements namely; actual outcomes and expected or standard outcomes.
Interim quality report: Interim quality performance report compares the actual quality at the end of the period with the budgeted costs and this report examines the progress attained within the period comparative to the planned level of progress for that period.
“Reorganize the monthly budget, prepare a budgeted cost of quality report, and identify the type of cost as variable (V) or fixed (F)”:
| Prevention costs | January | February |
| Quality planning (F) | $2,000 | $2,000 |
| New product review(F) | $500 | $500 |
| Quality training(F) | $1,000 | $1,000 |
| Total prevention costs | $3,500 | $3,500 |
| Appraisal costs | ||
| Materials inspection(F) | $2,500 | $2,500 |
| Product acceptance (V) | $13,000 | $15,000 |
| Field inspection (V) | $12,000 | $14,000 |
| Total appraisal costs | ||
| Internal failure costs | ||
| Scrap(V) | $10,000 | $12,000 |
| Retesting(V) | $6,000 | $7,200 |
| Rework(V) | $9,000 | $10,800 |
| Downtime(V) | $5,000 | $6,000 |
| Total internal failure costs | $30,000 | $36,000 |
| External failure costs | ||
| Warranty(V) | $15,000 | $18,000 |
| Allowances(V) | $7,500 | $9,000 |
| Complaint adjustment(F) | $2,500 | $2,500 |
| Total external failure costs | $25,000 | $29,500 |
| Total quality costs | $86,000 | $100,500 |
Table (1)
2.
Prepare a performance report for January that compares actual costs with budgeted costs. Comment on the progress of the company for improving quality and reducing its quality costs.
Explanation of Solution
Prepare a performance report comparing actual costs with budgeted costs and Comment on the progress of the company:
| Prevention costs: |
Actual costs (a) |
Budgeted Costs (b) |
Variance | |
| Quality planning (F) | $2,500 | $2,000 | $500 | U |
| New product review (F) | $700 | $500 | $200 | U |
| Quality training (F) | $1,000 | $1,000 | $0 | |
| Total prevention costs | $4,200 | $3,500 | $700 | U |
| Materials inspection (F) | $2,500 | $2,500 | $0 | |
| Product acceptance (V) | $14,000 | (2)$14,300 | ($300) | F |
| Field inspection (V) | $14,000 | (2)$13,200 | $800 | U |
| Total appraisal costs | $30,500 | $30,000 | $500 | U |
| Internal failure costs: | ||||
| Scrap (V) | $12,500 | (3)$11,000 | $1,500 | U |
| Retesting (V) | $7,000 | (4)$6,600 | $400 | U |
| Rework (V) | $11,000 | (5)$9,900 | $1,100 | U |
| Downtime (V) | $5,500 | (6)$5,500 | $0 | |
| Total internal failure costs | $36,000 | $33,000 | $3,000 | U |
| External failure costs: | ||||
| Warranty (V) | $17,500 | (7)$16,500 | $1,000 | U |
| Allowances (V) | $8,500 | (8)$8,250 | $250 | U |
| Complaint adjustment (F) | $2,500 | $2,500 | $0 | |
| Total external failure costs | $28,500 | $27,250 | $1,250 | U |
| Total quality costs | $99,200 | $93,750 | $5,450 | U |
Table (2)
- Budgeted costs must be adjusted to reflect actual sales of $550, 000; fixed costs usually don’t change with sales. Conversely, variable costs change with sales so that the “budgeted variable cost” could be used for making adjustment. For instance, the adjusted budgeted for scrap is $11,000(3).
- During the month of January, quality costs are 18 % (9) of sales and this is higher than the budgeted amount of 17 %, but lesser than earlier periods.
Working notes:
(1)Calculate the adjusted budget for product acceptance:
(2)Calculate the adjusted budget for field inspection:
(3)Calculate the adjusted budget for scrap:
(4)Calculate the adjusted budget for retesting:
(5)Calculate the adjusted budget for rework:
(6)Calculate the adjusted budget for downtime:
(7)Calculate the adjusted budget for warranty:
(8)Calculate the adjusted budget for allowances:
Note: Every amount of quality cost and the amount of sales is taken for the month of January.
(9)Calculate the percent of sales:
Want to see more full solutions like this?
Chapter 14 Solutions
Cornerstones of Cost Management


- The owner's equity at the beginning of the period for Vivo Enterprises was $52,000. At the end of the period, assets totaled $110,000, and liabilities were $28,000. If the owner made an additional investment of $12,000 and withdrew $9,000 during the period, what is the net income or (net loss) for the period?arrow_forwardAnswer me these problemsarrow_forwardAll answerarrow_forward
- 4 PTSarrow_forwardWhat is the amount of the conversion costs?arrow_forwardSuppose the following two independent investment opportunities are available to Fitz, Inc. The appropriate discount rate is 12%. Year Project Gamma Project Theta 0 -$2,500 -$4,100 1 1,300 800 2 1,100 2,100 3 900 3,600 Calculate the profitability index (PI) for each project. Which project should the company accept based on the PI rule? Consider the following cash flows on two mutually exclusive projects for a company. Both projects require an annual return of 15%. Year Project A Project B 0 -$725,500 -$1,450,900 1 275,000 889,000 2 413,800 647,330 3 382,075 554,280 As a financial analyst for the company, you are asked the following questions: If your decision rule is to accept the project with the higher IRR, which project should you choose? Because you are fully aware of the scale problem associated with IRR rule, you calculate the incremental IRR for the cash flows. Based on your…arrow_forward
 Cornerstones of Cost Management (Cornerstones Ser...AccountingISBN:9781305970663Author:Don R. Hansen, Maryanne M. MowenPublisher:Cengage Learning
 Managerial Accounting: The Cornerstone of Busines...AccountingISBN:9781337115773Author:Maryanne M. Mowen, Don R. Hansen, Dan L. HeitgerPublisher:Cengage Learning
 Principles of Accounting Volume 2AccountingISBN:9781947172609Author:OpenStaxPublisher:OpenStax College