
Videos
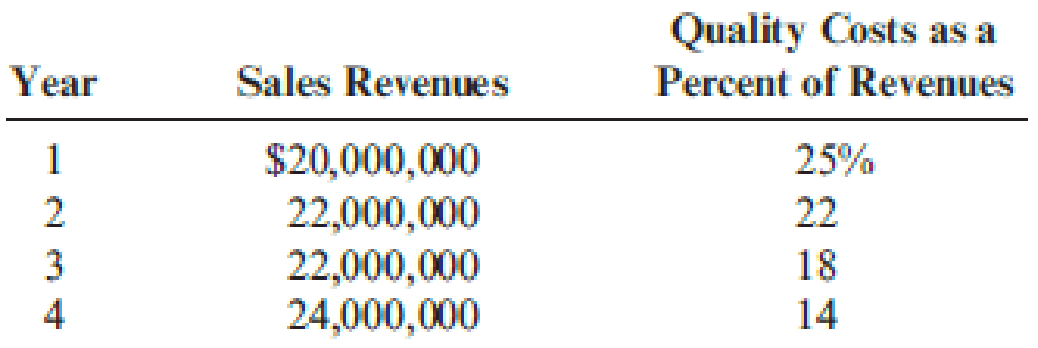
Gagnon Company reported the following sales and quality costs for the past four years. Assume that all quality costs are variable and that all changes in the quality cost ratios are due to a quality improvement program.
Required:
- 1. Compute the quality costs for all four years. By how much did net income increase from Year 1 to Year 2 because of quality improvements? From Year 2 to Year 3? From Year 3 to Year 4?
- 2. The management of Gagnon Company believes it is possible to reduce quality costs to 2.5 percent of sales. Assuming sales will continue at the Year 4 level, calculate the additional profit potential facing Gagnon. Is the expectation of improving quality and reducing costs to 2.5 percent of sales realistic? Explain.
- 3. Assume that Gagnon produces one type of product, which is sold on a bid basis. In Years 1 and 2, the average bid was $400. In Year 1, total variable costs were $250 per unit. In Year 3, competition forced the bid to drop to $380. Compute the total contribution margin in Year 3 assuming the same quality costs as in Year 1. Now, compute the total contribution margin in Year 3 using the actual quality costs for Year 3. What is the increase in profitability resulting from the quality improvements made from Year 1 to Year 3?
1.
Compute the quality costs for all four years and calculate the amount of increase in net income from year 1 to year 2, from year 2 to year 3, and from year 3 to year 4.
Explanation of Solution
Quality costs: Quality costs are costs that are incurred to avoid, identify and eliminate defects from products. Quality costs are classified into four components namely;
- “Prevention costs”.
- “Appraisal costs”.
- “Internal failure costs”.
- “External failure costs”.
Calculate the quality costs for all the four years:
| Year | Percent of revenues | × | Sales revenues | = | Quality costs |
| Year 1 | 25% | $20,000,000 | $5,000,000 | ||
| year 2 | 22% | $22,000,000 | $4,840,000 | ||
| Year 3 | 18% | $22,000,000 | $3,960,000 | ||
| Year 4 | 14% | $24,000,000 | $3,960,000 |
Table (1)
Calculate the increase in net income from year 1 to year 2:
Calculate the increase in net income from year 2 to year 3:
Calculate the increase in net income from year 3 to year 4:
2.
Calculate the additional profit potential facing Company G and state whether expecting improved quality and reduced costs to 2.5 percent of sales is realistic.
Explanation of Solution
Calculate the profit potential:
Therefore, from the above calculation, it is ascertained that amount of profit potential is $2,760,000.
The 2.5 percent goal is the level identified by several quality experts that a company must strive to obtain. The experience of company G shows that it is an achievable goal
3.
Calculate the total contribution margin in year 3 assuming the same quality costs as in year 1 compute the total contribution margin in year 3 using the actual quality costs for year 3 and calculate the increase in profitability resulting from the quality improvements made from year 1 to year 3.
Explanation of Solution
Contribution Margin: The process or theory which is used to judge the benefit given by each unit of the goods produced is called as contribution margin.
Calculate the total contribution margin in year 3 assuming the same quality costs as in year 1 compute the total contribution margin in year 3 using the actual quality costs for year 3:
| Year 3-No change | Year 3-change | |
| Sales | $22,000,000 | $22,000,000 |
| Variable expenses | (1)$14,473,684 | (6)$11,764,210 |
| Contribution margin | $7,526,316 | $10,235,790 |
Table (2)
Calculate the increase in profitability:
Therefore, the amount of increase in profitability is $2,709,474.
Working notes:
(1)Calculate the variable expenses in year 3 assuming the same quality costs as in year 1:
(2)Calculate the quality cost per unit for year 1:
(3)Calculate the quality cost per unit for year 3:
(4)Calculate the decrease in per-unit variable quality cost:
(5)Calculate the decrease in per-unit total variable cost:
(6)Calculate the total variable cost for year 3:
Want to see more full solutions like this?
Chapter 14 Solutions
Cornerstones of Cost Management


- On November 30, Sullivan Enterprises had Accounts Receivable of $145,600. During the month of December, the company received total payments of $175,000 from credit customers. The Accounts Receivable on December 31 was $98,200. What was the number of credit sales during December?arrow_forwardPaterson Manufacturing uses both standards and budgets. For the year, estimated production of Product Z is 620,000 units. The total estimated cost for materials and labor are $1,512,000 and $1,984,000, respectively. Compute the estimates for: (a) a standard cost per unit (b) a budgeted cost for total production (Round standard costs to 2 decimal places, e.g., $1.25.)arrow_forwardQuestion: Gujri Place Clock Shop sold a grandfather clock for $2,250 subject to a 9% sales tax. The entry in the general journal will include a credit to Sales for a) $2,250.00 b) $2,092.50 c) $2,452.50. choose the correct optionarrow_forward
 Cornerstones of Cost Management (Cornerstones Ser...AccountingISBN:9781305970663Author:Don R. Hansen, Maryanne M. MowenPublisher:Cengage Learning
 Managerial Accounting: The Cornerstone of Busines...AccountingISBN:9781337115773Author:Maryanne M. Mowen, Don R. Hansen, Dan L. HeitgerPublisher:Cengage Learning
 Essentials of Business Analytics (MindTap Course ...StatisticsISBN:9781305627734Author:Jeffrey D. Camm, James J. Cochran, Michael J. Fry, Jeffrey W. Ohlmann, David R. AndersonPublisher:Cengage Learning
 Excel Applications for Accounting PrinciplesAccountingISBN:9781111581565Author:Gaylord N. SmithPublisher:Cengage Learning