
Introduction To Statistics And Data Analysis
6th Edition
ISBN: 9781337793612
Author: PECK, Roxy.
Publisher: Cengage Learning,
expand_more
expand_more
format_list_bulleted
Concept explainers
Videos
Textbook Question
Chapter 1.4, Problem 28E
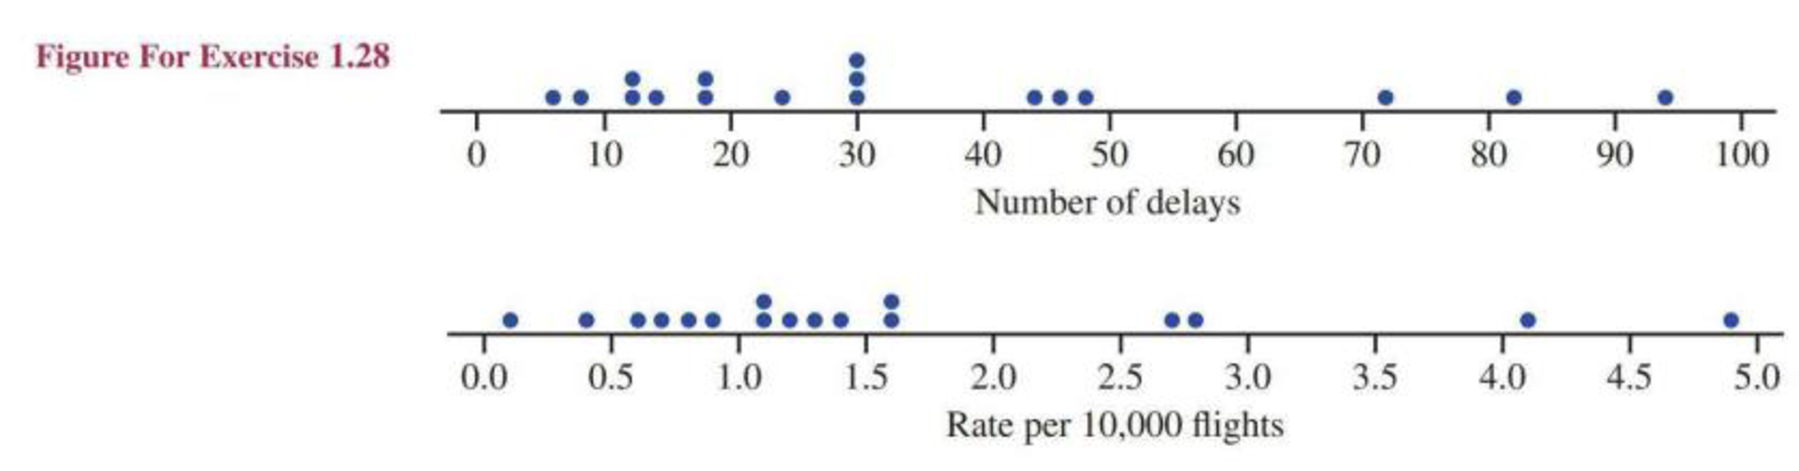
The article “Fliers Trapped on Tarmac Push for Rules on Release” (USA TODAY, July 28, 2009) gave the following data for 17 airlines on number of flights that were delayed on the tarmac for at least 3 hours for the period from October 2008 to May 2009:
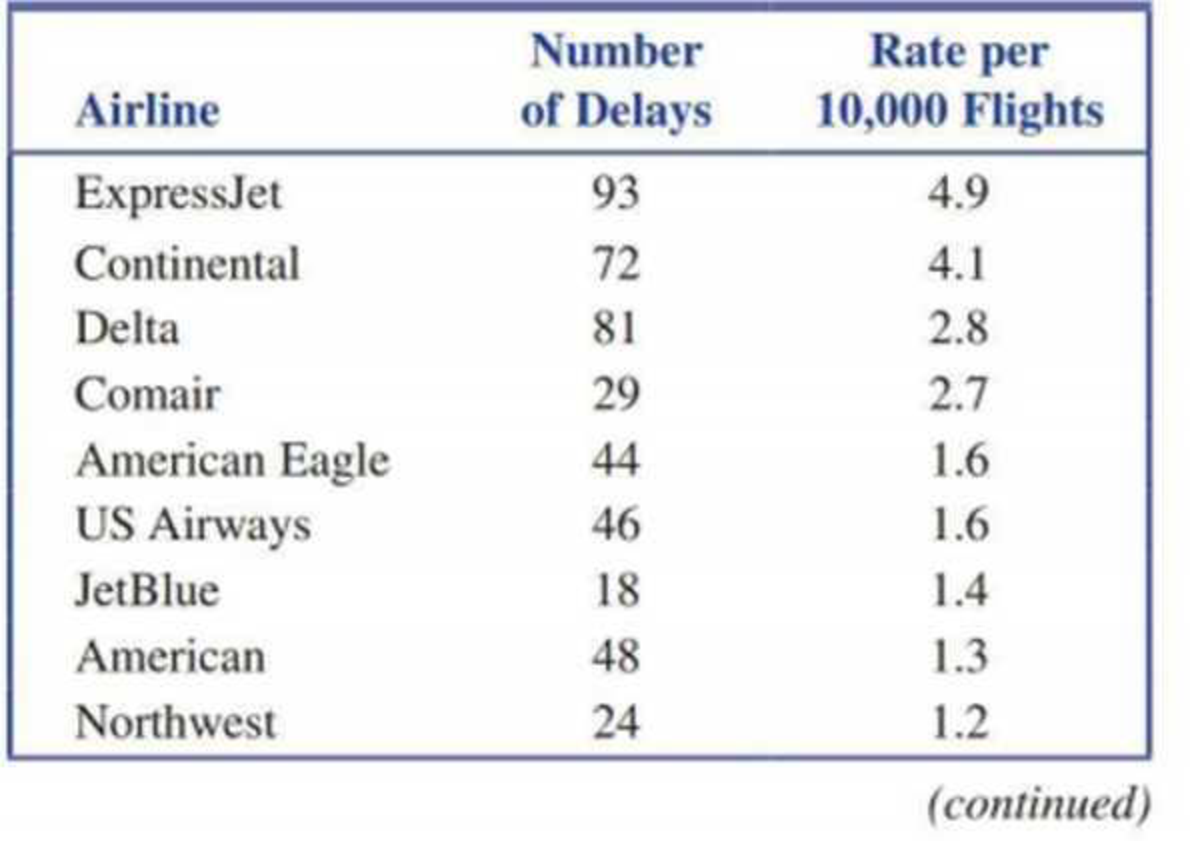
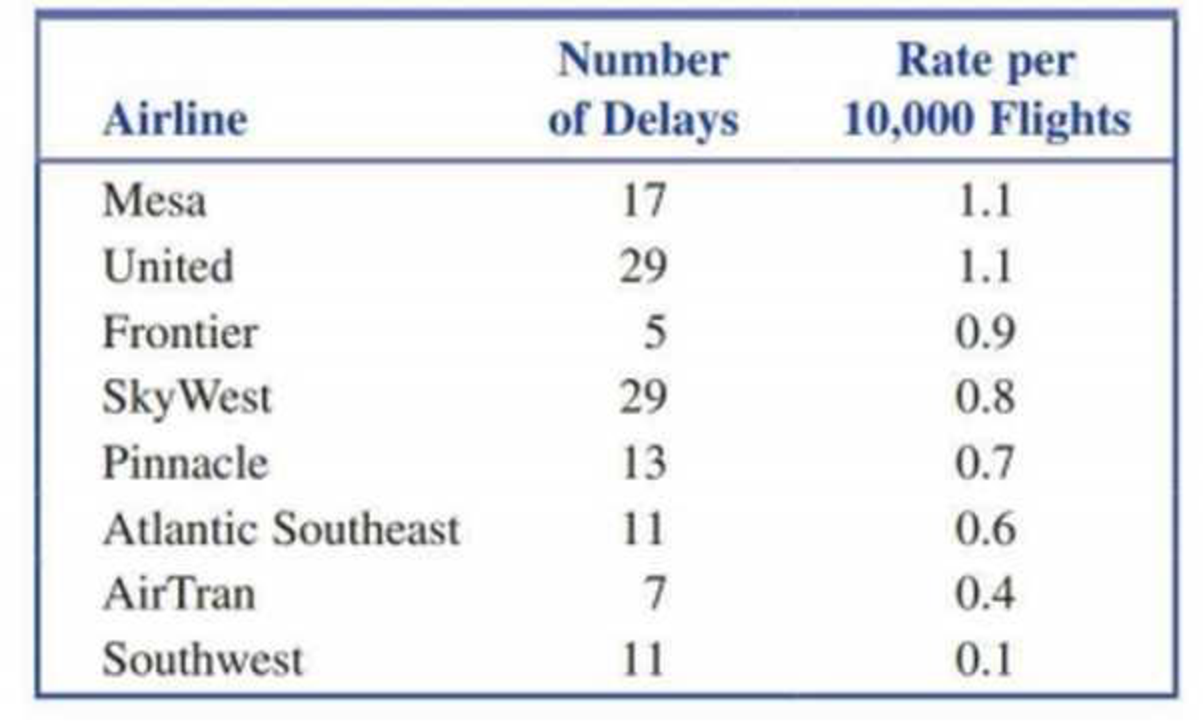
The graph at the bottom of the page shows two dot-plots: one displays the number of delays data, and one displays the rate per 10,000 flights data.
- a. If you were going to rank airlines based on flights delayed on the tarmac for at least 3 hours, would you use the total number of flights data or the rate per 10,000 flights data? Explain the reason for your choice.
- b. Write a short paragraph that could be used as part of a newspaper article on flight delays that could accompany the dotplot of the rate per 10,000 flights data.
Expert Solution & Answer

Trending nowThis is a popular solution!

Students have asked these similar questions
I need help with this problem and an explanation of the solution for the image described below. (Statistics: Engineering Probabilities)
I need help with this problem and an explanation of the solution for the image described below. (Statistics: Engineering Probabilities)
This exercise is based on the following data on four bodybuilding supplements. (Figures shown correspond to a single serving.)
Creatine(grams)
L-Glutamine(grams)
BCAAs(grams)
Cost($)
Xtend(SciVation)
0
2.5
7
1.00
Gainz(MP Hardcore)
2
3
6
1.10
Strongevity(Bill Phillips)
2.5
1
0
1.20
Muscle Physique(EAS)
2
2
0
1.00
Your personal trainer suggests that you supplement with at least 10 grams of creatine, 39 grams of L-glutamine, and 90 grams of BCAAs each week. You are thinking of combining Xtend and Gainz to provide you with the required nutrients. How many servings of each should you combine to obtain a week's supply that meets your trainer's specifications at the least cost? (If an answer does not exist, enter DNE.)
servings of xtend servings of gainz
Chapter 1 Solutions
Introduction To Statistics And Data Analysis
Ch. 1.3 - Give brief definitions of the terms descriptive...Ch. 1.3 - Give brief definitions of the terms population and...Ch. 1.3 - The following conclusion from a study appeared in...Ch. 1.3 - Based on a study of 2 121 children between the...Ch. 1.3 - The student senate at a university with 15,000...Ch. 1.3 - The National Retail Federation used data from a...Ch. 1.3 - The supervisors of a rural county are interested...Ch. 1.3 - A consumer group conducts crash tests of new model...Ch. 1.3 - A building contractor has a chance to buy an odd...Ch. 1.3 - The article Brain Shunt Tested to Treat Alzheimers...
Ch. 1.3 - In a study of whether taking a garlic supplement...Ch. 1.4 - Classify each of the following variables as either...Ch. 1.4 - Classify each of the following variables as either...Ch. 1.4 - For the following numerical variables, state...Ch. 1.4 - For the following numerical variables, state...Ch. 1.4 - For each of the following situations, give a set...Ch. 1.4 - In a survey of 100 people who had recently...Ch. 1.4 - The Gallup report More Americans Say Real Estate...Ch. 1.4 - An article in the New Times San Luis Obispo...Ch. 1.4 - Box Office Mojo (boxofficemojo.com) tracks movie...Ch. 1.4 - The report With Their Whole Lives Ahead of Them...Ch. 1.4 - The following display is a graph similar to one...Ch. 1.4 - The accompanying table gives the total number...Ch. 1.4 - Heal the Bay is an environmental organization that...Ch. 1.4 - The report referenced in the previous exercise...Ch. 1.4 - The U.S. Department of Health and Human Services...Ch. 1.4 - Example 1.5 gave the accompanying data on violent...Ch. 1.4 - The article Fliers Trapped on Tarmac Push for...Ch. 1.4 - The report Trends m Community Colleges...Ch. 1.4 - The article Where College Students Buy Textbooks...Ch. 1.4 - Prob. 31ECh. 1.4 - In the United States, movies are rated by the...Ch. 1 - The report Testing the Waters 2009 (nrdc.org)...Ch. 1 - The U.S. Department of Education reported that 14%...Ch. 1 - The Computer Assisted Assessment Center at the...Ch. 1 - The article Just How Safe Is That Jet? (USA TODAY,...Ch. 1 - Each year, U.S. News and World Report publishes a...Ch. 1 - Many adolescent boys aspire to be professional...
Knowledge Booster


Learn more about
Need a deep-dive on the concept behind this application? Look no further. Learn more about this topic, statistics and related others by exploring similar questions and additional content below.Similar questions
- I need help with this problem and an explanation of the solution for the image described below. (Statistics: Engineering Probabilities)arrow_forwardI need help with this problem and an explanation of the solution for the image described below. (Statistics: Engineering Probabilities)arrow_forwardDATA TABLE VALUES Meal Price ($) 22.78 31.90 33.89 22.77 18.04 23.29 35.28 42.38 36.88 38.55 41.68 25.73 34.19 31.75 25.24 26.32 19.57 36.57 32.97 36.83 30.17 37.29 25.37 24.71 28.79 32.83 43.00 35.23 34.76 33.06 27.73 31.89 38.47 39.42 40.72 43.92 36.51 45.25 33.51 29.17 30.54 26.74 37.93arrow_forward
- I need help with this problem and an explanation of the solution for the image described below. (Statistics: Engineering Probabilities)arrow_forwardSales personnel for Skillings Distributors submit weekly reports listing the customer contacts made during the week. A sample of 65 weekly reports showed a sample mean of 19.5 customer contacts per week. The sample standard deviation was 5.2. Provide 90% and 95% confidence intervals for the population mean number of weekly customer contacts for the sales personnel. 90% Confidence interval, to 2 decimals: ( , ) 95% Confidence interval, to 2 decimals:arrow_forwardA simple random sample of 40 items resulted in a sample mean of 25. The population standard deviation is 5. a. What is the standard error of the mean (to 2 decimals)? b. At 95% confidence, what is the margin of error (to 2 decimals)?arrow_forward
- mean trough level of the population to be 3.7 micrograms/mL. The researcher conducts a study among 93 newly diagnosed arthritis patients and finds the mean trough to be 4.1 micrograms/mL with a standard deviation of 2.4 micrograms/mL. The researcher wants to test at the 5% level of significance if the trough is different than previously reported or not. Z statistics will be used. Complete Step 5 of hypothesis testing: Conclusion. State whether or not you would reject the null hypothesis and why. Also interpret what this means (i.e. is the mean trough different from 3.7 or noarrow_forward30% of all college students major in STEM (Science, Technology, Engineering, and Math). If 48 college students are randomly selected, find the probability thata. Exactly 12 of them major in STEM. b. At most 17 of them major in STEM. c. At least 12 of them major in STEM. d. Between 9 and 13 (including 9 and 13) of them major in STEM.arrow_forward7% of all Americans live in poverty. If 40 Americans are randomly selected, find the probability thata. Exactly 4 of them live in poverty. b. At most 1 of them live in poverty. c. At least 1 of them live in poverty. d. Between 2 and 9 (including 2 and 9) of them live in poverty.arrow_forward
- 48% of all violent felons in the prison system are repeat offenders. If 40 violent felons are randomly selected, find the probability that a. Exactly 18 of them are repeat offenders. b. At most 18 of them are repeat offenders. c. At least 18 of them are repeat offenders. d. Between 17 and 21 (including 17 and 21) of them are repeat offenders.arrow_forwardConsider an MA(6) model with θ1 = 0.5, θ2 = −25, θ3 = 0.125, θ4 = −0.0625, θ5 = 0.03125, and θ6 = −0.015625. Find a much simpler model that has nearly the same ψ-weights.arrow_forwardLet {Yt} be an AR(2) process of the special form Yt = φ2Yt − 2 + et. Use first principles to find the range of values of φ2 for which the process is stationary.arrow_forward
arrow_back_ios
SEE MORE QUESTIONS
arrow_forward_ios
Recommended textbooks for you
 Glencoe Algebra 1, Student Edition, 9780079039897...AlgebraISBN:9780079039897Author:CarterPublisher:McGraw Hill
 Big Ideas Math A Bridge To Success Algebra 1: Stu...AlgebraISBN:9781680331141Author:HOUGHTON MIFFLIN HARCOURTPublisher:Houghton Mifflin Harcourt
 Holt Mcdougal Larson Pre-algebra: Student Edition...AlgebraISBN:9780547587776Author:HOLT MCDOUGALPublisher:HOLT MCDOUGAL
 College Algebra (MindTap Course List)AlgebraISBN:9781305652231Author:R. David Gustafson, Jeff HughesPublisher:Cengage Learning
 Functions and Change: A Modeling Approach to Coll...AlgebraISBN:9781337111348Author:Bruce Crauder, Benny Evans, Alan NoellPublisher:Cengage Learning
Glencoe Algebra 1, Student Edition, 9780079039897...
Algebra
ISBN:9780079039897
Author:Carter
Publisher:McGraw Hill
Big Ideas Math A Bridge To Success Algebra 1: Stu...
Algebra
ISBN:9781680331141
Author:HOUGHTON MIFFLIN HARCOURT
Publisher:Houghton Mifflin Harcourt
Holt Mcdougal Larson Pre-algebra: Student Edition...
Algebra
ISBN:9780547587776
Author:HOLT MCDOUGAL
Publisher:HOLT MCDOUGAL
College Algebra (MindTap Course List)
Algebra
ISBN:9781305652231
Author:R. David Gustafson, Jeff Hughes
Publisher:Cengage Learning
Functions and Change: A Modeling Approach to Coll...
Algebra
ISBN:9781337111348
Author:Bruce Crauder, Benny Evans, Alan Noell
Publisher:Cengage Learning
Sampling Methods and Bias with Surveys: Crash Course Statistics #10; Author: CrashCourse;https://www.youtube.com/watch?v=Rf-fIpB4D50;License: Standard YouTube License, CC-BY
Statistics: Sampling Methods; Author: Mathispower4u;https://www.youtube.com/watch?v=s6ApdTvgvOs;License: Standard YouTube License, CC-BY