
Concept explainers
Videos
Example 1.5 gave the accompanying data on violent crime on public college campuses in Florida during 2016 (fbi.gov, retrieved February 6, 2018):
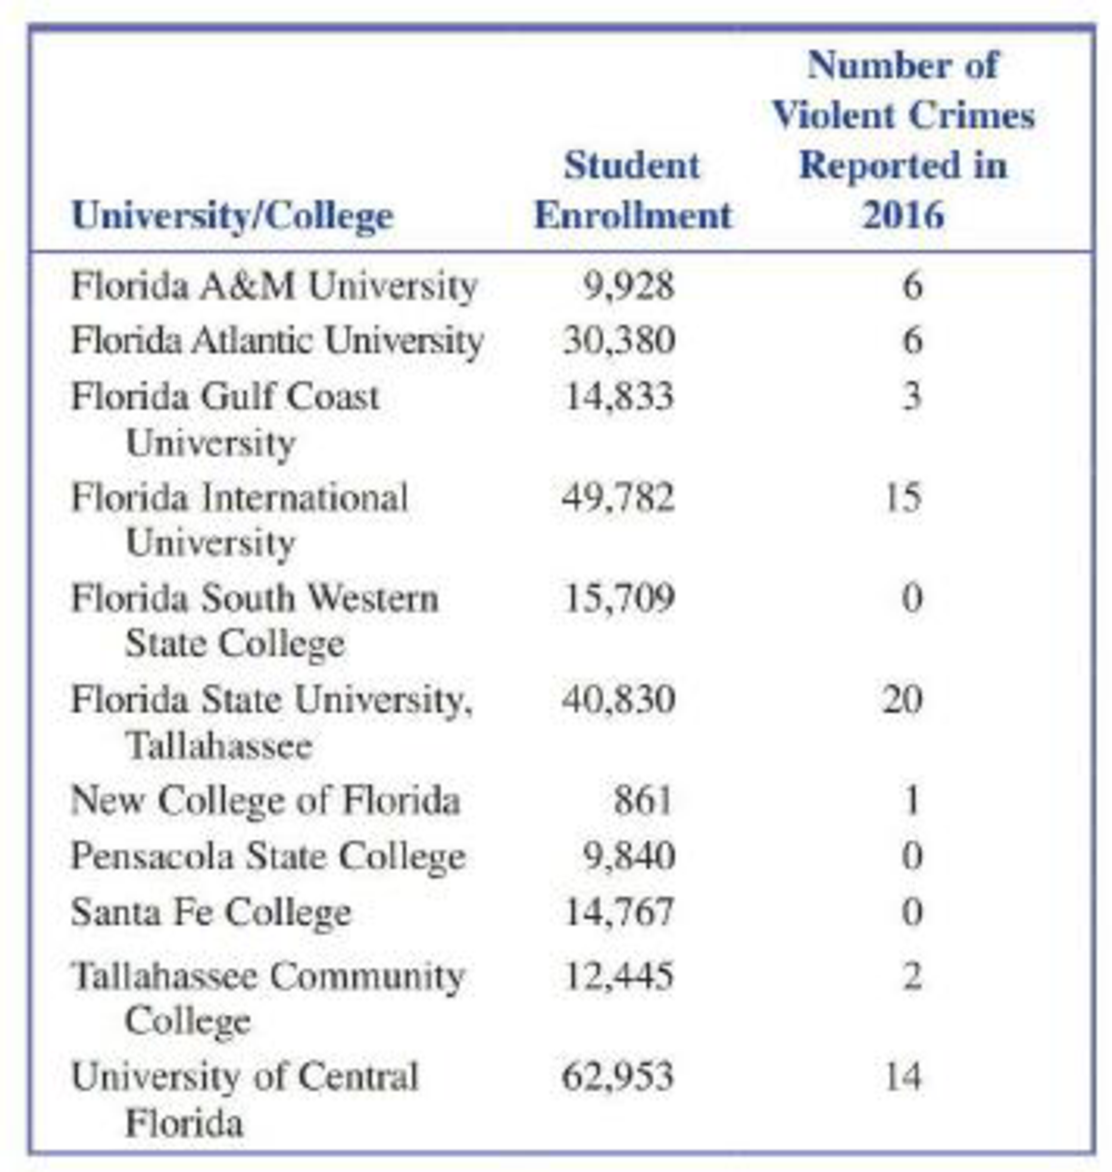
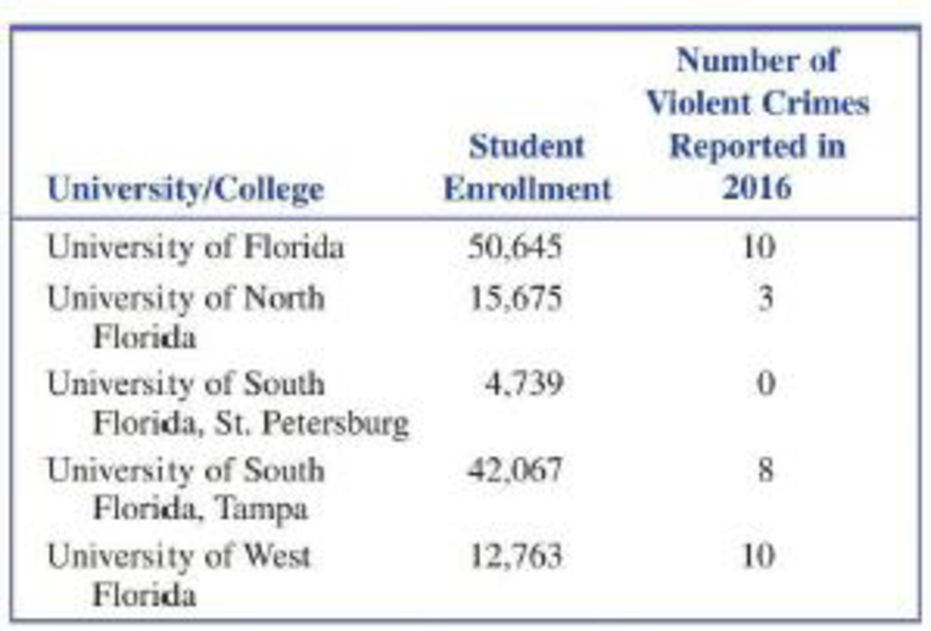
- a. Construct a dotplot using the 16 observations on number of violent crimes reported. Which schools stand out from the rest?
- b. One of the Florida schools has only 861 students and a few of the schools are quite a bit larger than the rest. Because of this, it might make more sense to consider a crime rate by calculating the number of violent crimes reported per 1000 students. For example, for Florida A&M University the violent crime rate would be
Calculate the violent crime rate for the other 15 schools and then use those values to construct a dotplot. Do the same schools stand out as unusual in this dotplot?
- c. Based on your answers from Parts (a) and (b), write a couple of sentences commenting on violent crimes reported at Florida universities and colleges in 2016.
a.
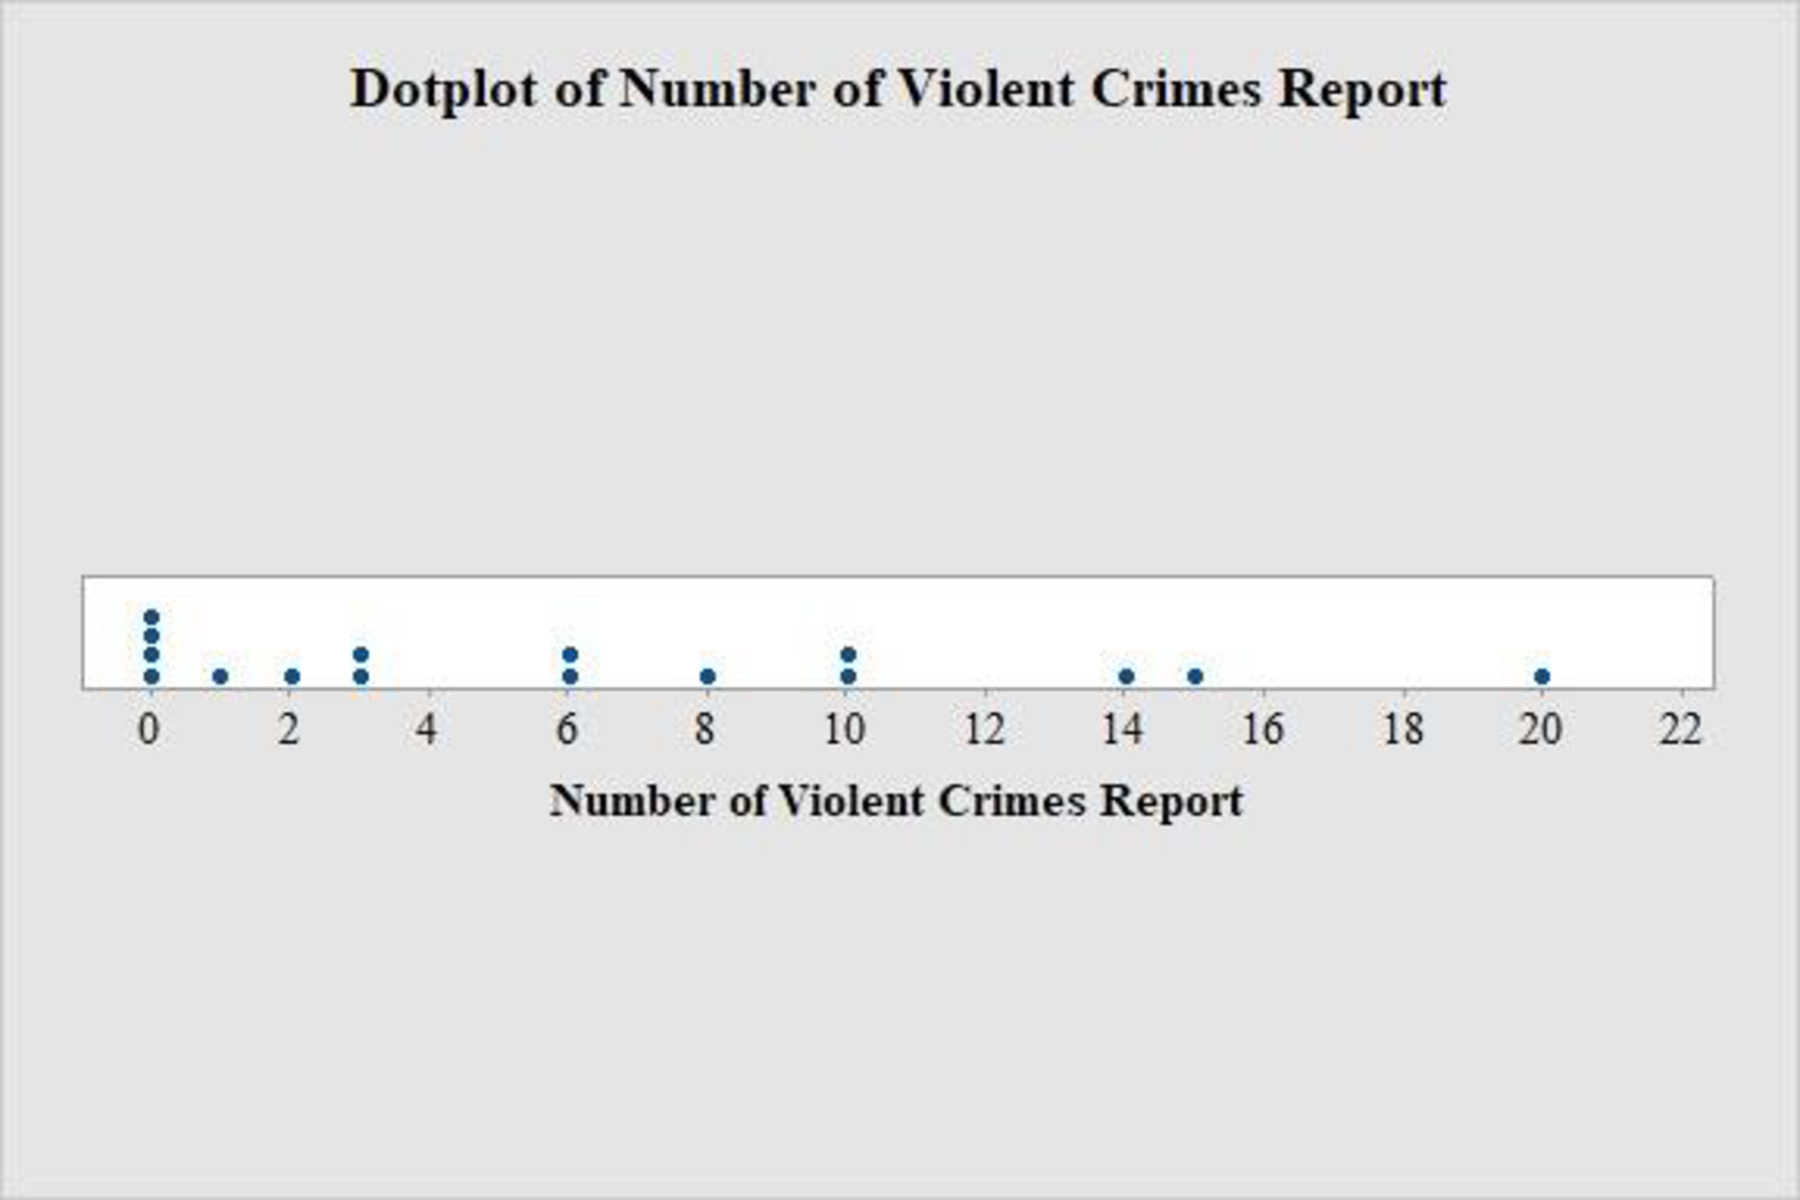
Draw a dot plot using the 16 observations on number of violent crimes reported.
Find the schools that stand out from the rest.
Answer to Problem 27E
The dot plot using the 16 observations on number of violent crimes reported is given below:
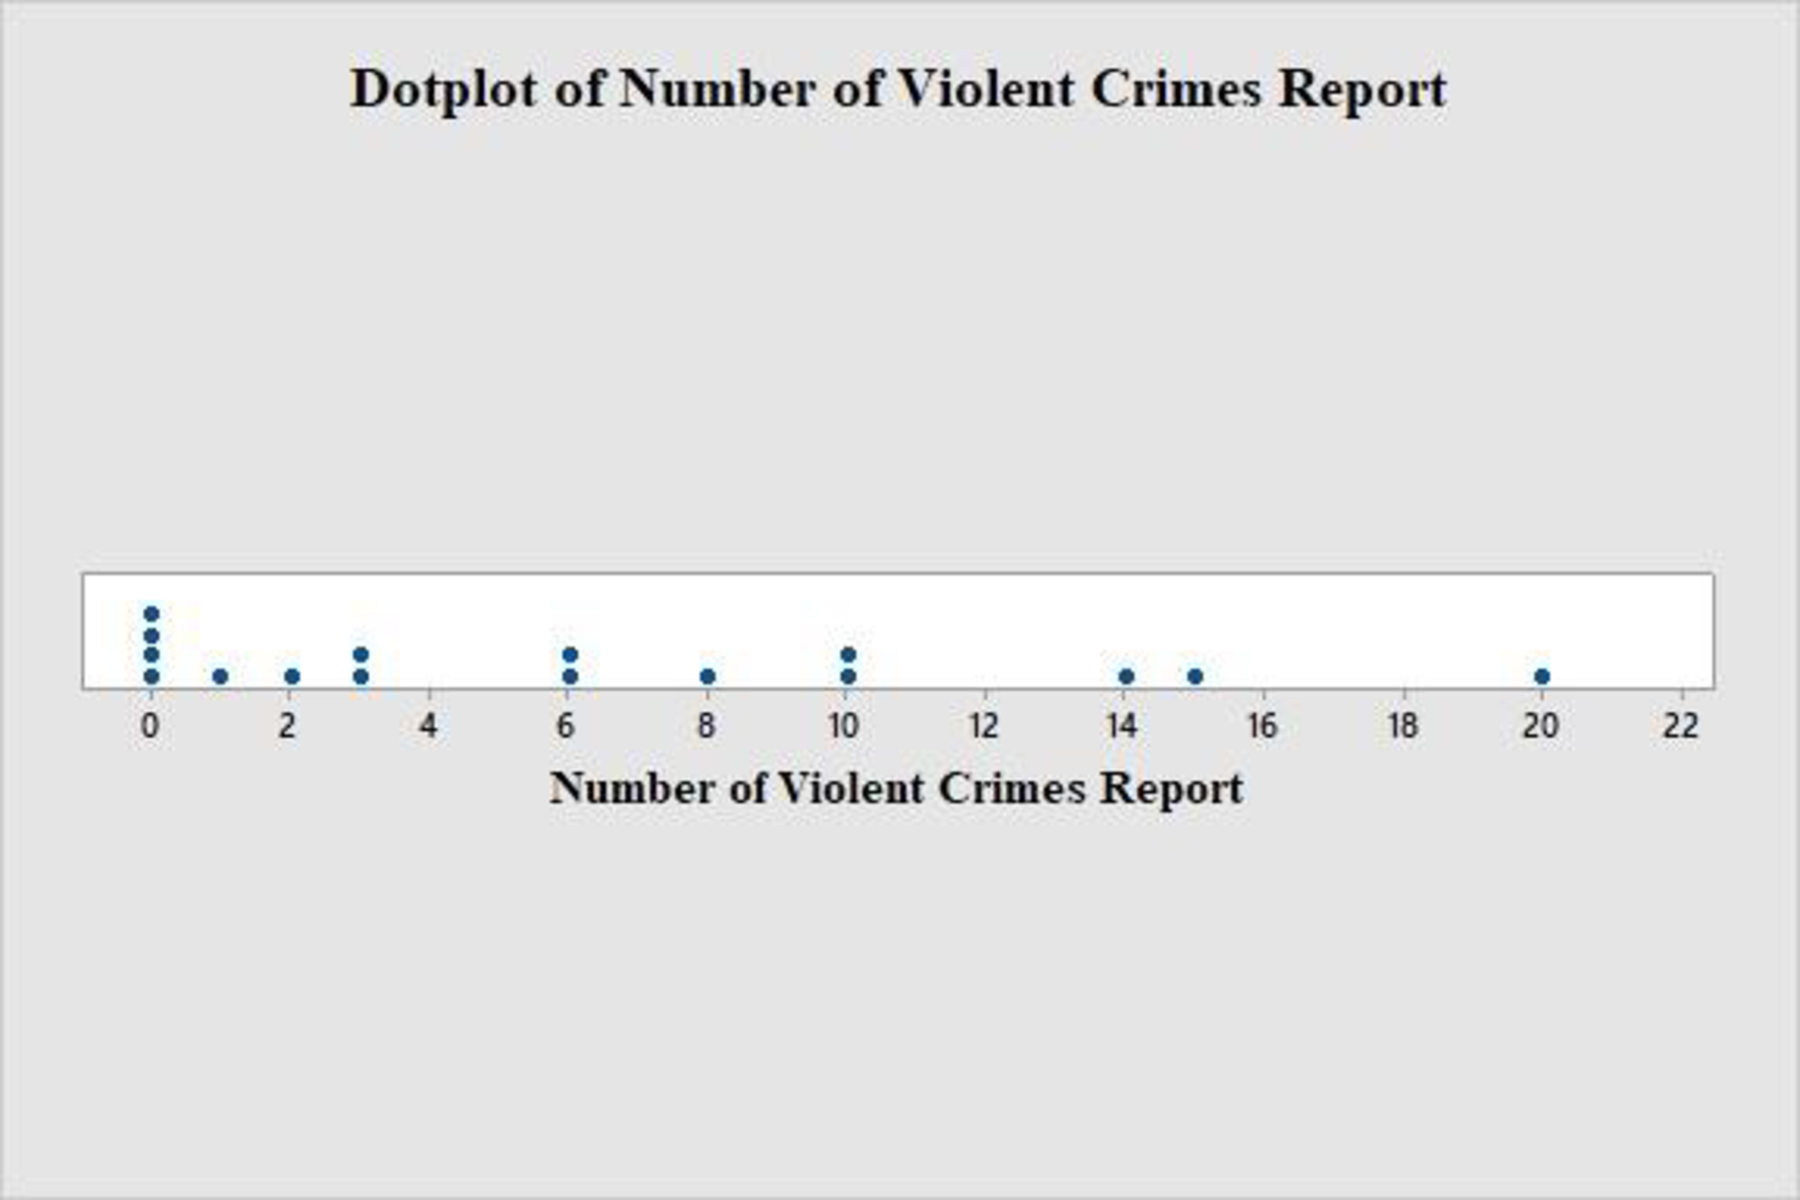
University of Central Florida, Florida International University and Florida State University are stand out from the rest.
Explanation of Solution
Calculation:
The data represents the number of violent crimes reported in 2016 on public college campuses in Florida.
Software procedure:
Step by step procedure to obtain dot-plot using MINITAB software is given below:
- Choose Graph > Dot plot.
- Choose One Y, select simple and then click OK.
- In Graph variables, enter the column of Number of Violent Crimes Report.
- Click OK.
Observation: From the dot plot, it can be observed that three schools stand out from the rest, since higher number of crimes is reported in these schools compared to the rest.
Thus, the schools University of Central Florida, Florida International University and Florida State University are stand out from the rest.
b.
Find the violent crime rate for the other 15 schools and then draw a dot plot using these values.
Check whether the same schools stand out as unusual in this plot.
Answer to Problem 27E
The violent crime rates for the other 15 schools are as follows:
| University/College | Violent Crime Rate Per 1,000 Students |
| Florida A&M University | 0.60435 |
| Florida Atlantic University | 0.19750 |
| Florida Gulf Coast University | 0.20225 |
| Florida International University | 0.301310 |
| Florida South Western State College | 0 |
| Florida State University, Tallahassee | 0.48984 |
| New College of Florida | 1.161441 |
| Pensacola State College | 0 |
| Santa Fe College | 0 |
| Tallahassee Community College | 0.16071 |
| University of Central Florida | 0.22239 |
| University of Florida | 0.19745 |
| University of North Florida | |
| University of South Florida, St. Petersburg | 0 |
| University of South Florida, Tampa | 0.19017 |
| University of West Florida | 0.783510 |
The dot plot using the 16 observations on violent crime rate is given below:
The schools stand out as unusual are not same.
Explanation of Solution
It is given that the violent crime rate for Florida A&M University is calculated as follows:
Then the violent crime rates for the other 15 schools are obtained as follows:
| University/College | Violent Crime Rate Per 1,000 Students |
| Florida A&M University | |
| Florida Atlantic University | |
| Florida Gulf Coast University | |
| Florida International University | |
| Florida South Western State College | |
| Florida State University, Tallahassee | |
| New College of Florida | |
| Pensacola State College | |
| Santa Fe College | |
| Tallahassee Community College | |
| University of Central Florida | |
| University of Florida | |
| University of North Florida | |
| University of South Florida, St. Petersburg | |
| University of South Florida, Tampa | |
| University of West Florida |
Software procedure:
Step by step procedure to obtain dot-plot using MINITAB software is given below:
- Choose Graph > Dot plot.
- Choose One Y, select simple and then click OK.
- In Graph variables, enter the column of Number of Violent Crimes Report.
- Click OK.
Observation: From the dot plot, it can be observed that the schools Florida State University, Florida A&M University and University of West Florida and New College of Florida stand out from the rest, since it has high crime rate than other schools.
Thus, the schools stand out as unusual are not same.
c.
Comment on the violent crimes reported at Florida universities and college in 2016 based on the part (a) and (b).
Explanation of Solution
From part (a), it can be observed that there are three schools that stand out from the rest since these schools have higher number of crimes compared to the rest. However, majority of schools have almost similar and low number of crimes.
From part (b), it can be observed that there are four schools that stand out from the rest since these schools have higher crime rate compared to the rest. Also there are four schools having low crime rate that also stand out from the rest.
Want to see more full solutions like this?
Chapter 1 Solutions
Introduction To Statistics And Data Analysis


- F Make a box plot from the five-number summary: 100, 105, 120, 135, 140. harrow_forward14 Is the standard deviation affected by skewed data? If so, how? foldarrow_forwardFrequency 15 Suppose that your friend believes his gambling partner plays with a loaded die (not fair). He shows you a graph of the outcomes of the games played with this die (see the following figure). Based on this graph, do you agree with this person? Why or why not? 65 Single Die Outcomes: Graph 1 60 55 50 45 40 1 2 3 4 Outcome 55 6arrow_forward
- lie y H 16 The first month's telephone bills for new customers of a certain phone company are shown in the following figure. The histogram showing the bills is misleading, however. Explain why, and suggest a solution. Frequency 140 120 100 80 60 40 20 0 0 20 40 60 80 Telephone Bill ($) 100 120arrow_forward25 ptical rule applies because t Does the empirical rule apply to the data set shown in the following figure? Explain. 2 6 5 Frequency 3 сл 2 1 0 2 4 6 8 00arrow_forward24 Line graphs typically connect the dots that represent the data values over time. If the time increments between the dots are large, explain why the line graph can be somewhat misleading.arrow_forward
- 17 Make a box plot from the five-number summary: 3, 4, 7, 16, 17. 992) waarrow_forward12 10 - 8 6 4 29 0 Interpret the shape, center and spread of the following box plot. brill smo slob.nl bagharrow_forwardSuppose that a driver's test has a mean score of 7 (out of 10 points) and standard deviation 0.5. a. Explain why you can reasonably assume that the data set of the test scores is mound-shaped. b. For the drivers taking this particular test, where should 68 percent of them score? c. Where should 95 percent of them score? d. Where should 99.7 percent of them score? Sarrow_forward
- 13 Can the mean of a data set be higher than most of the values in the set? If so, how? Can the median of a set be higher than most of the values? If so, how? srit to estaarrow_forwardA random variable X takes values 0 and 1 with probabilities q and p, respectively, with q+p=1. find the moment generating function of X and show that all the moments about the origin equal p. (Note- Please include as much detailed solution/steps in the solution to understand, Thank you!)arrow_forward1 (Expected Shortfall) Suppose the price of an asset Pt follows a normal random walk, i.e., Pt = Po+r₁ + ... + rt with r₁, r2,... being IID N(μ, o²). Po+r1+. ⚫ Suppose the VaR of rt is VaRq(rt) at level q, find the VaR of the price in T days, i.e., VaRq(Pt – Pt–T). - • If ESq(rt) = A, find ES₁(Pt – Pt–T).arrow_forward
 Glencoe Algebra 1, Student Edition, 9780079039897...AlgebraISBN:9780079039897Author:CarterPublisher:McGraw Hill
 Holt Mcdougal Larson Pre-algebra: Student Edition...AlgebraISBN:9780547587776Author:HOLT MCDOUGALPublisher:HOLT MCDOUGAL
 Big Ideas Math A Bridge To Success Algebra 1: Stu...AlgebraISBN:9781680331141Author:HOUGHTON MIFFLIN HARCOURTPublisher:Houghton Mifflin Harcourt
 Functions and Change: A Modeling Approach to Coll...AlgebraISBN:9781337111348Author:Bruce Crauder, Benny Evans, Alan NoellPublisher:Cengage Learning