
APPLIED STAT.IN BUS.+ECONOMICS
6th Edition
ISBN: 9781259957598
Author: DOANE
Publisher: RENT MCG
expand_more
expand_more
format_list_bulleted
Videos
Textbook Question
Chapter 14, Problem 25CE
(a) Plot U.S. petroleum imports on a graph. (b) Describe the trend (if any) and discuss possible causes. (c) Fit linear, exponential, and quadratic trends. (c) Do any of these trends seem appropriate to make forecasts? Explain. (d) Make a projection for 2020 using any method (including judgment or a moving average). Do you believe it? Explain. Note: Time increments are five years, so use t = 13 for the 2020 forecast.
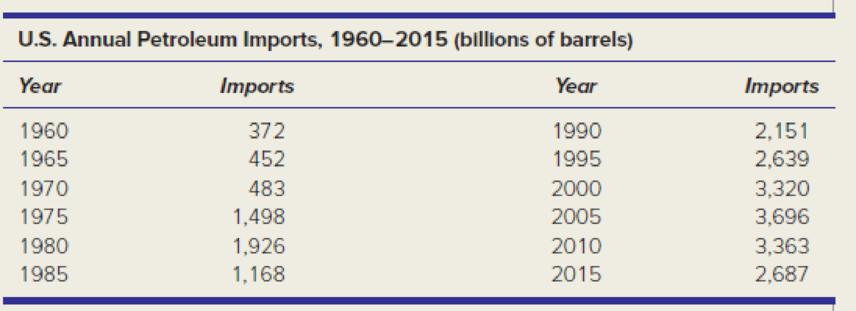
Source: www.eia.doe.gov.
Expert Solution & Answer
Want to see the full answer?
Check out a sample textbook solution
Students have asked these similar questions
Business
https://www.hawkeslearning.com/Statistics/dbs2/datasets.html
NC Current Students - North Ce X | NC Canvas Login Links - North ( X
Final Exam Comprehensive x Cengage Learning
x
WASTAT - Final Exam - STAT
→
C
webassign.net/web/Student/Assignment-Responses/submit?dep=36055360&tags=autosave#question3659890_9
Part (b)
Draw a scatter plot of the ordered pairs.
N
Life
Expectancy
Life
Expectancy
80
70
600
50
40
30
20
10
Year of
1950
1970 1990
2010 Birth
O
Life
Expectancy
Part (c)
800
70
60
50
40
30
20
10
1950
1970 1990
W
ALT
林
$
#
4
R
J7
Year of
2010 Birth
F6
4+
80
70
60
50
40
30
20
10
Year of
1950 1970 1990
2010 Birth
Life
Expectancy
Ox
800
70
60
50
40
30
20
10
Year of
1950 1970 1990 2010 Birth
hp
P.B.
KA
&
7
80
% 5
H
A
B
F10
711
N
M
K
744
PRT SC
ALT
CTRL
Chapter 14 Solutions
APPLIED STAT.IN BUS.+ECONOMICS
Ch. 14.2 - (a) Make an Excel graph of the data on the number...Ch. 14.2 - Prob. 3SECh. 14.2 - Prob. 4SECh. 14.2 - Prob. 5SECh. 14.4 - (a) Make an Excel line graph of the exchange rate...Ch. 14.5 - (a) Make an Excel line graph of the following bond...Ch. 14 - Explain the difference between (a) stocks and...Ch. 14 - (a) What is periodicity? (b) Give original...Ch. 14 - (a) What are the distinguishing features of each...Ch. 14 - Name four criteria for assessing a trend forecast.
Ch. 14 - Name two advantages and two disadvantages of each...Ch. 14 - When would the exponential trend model be...Ch. 14 - Explain how to obtain the compound percent growth...Ch. 14 - (a) When might a quadratic model be useful? (b)...Ch. 14 - Name five measures of fit for a trend, and state...Ch. 14 - Prob. 10CRCh. 14 - Prob. 11CRCh. 14 - Prob. 12CRCh. 14 - (a) Why is seasonality irrelevant for annual data?...Ch. 14 - Prob. 14CRCh. 14 - (a) Explain how seasonal binaries can be used to...Ch. 14 - What is the purpose of index numbers?Ch. 14 - (a) Make a line chart for JetBlues revenue. (b)...Ch. 14 - (a) Plot both Swiss watch time series on the same...Ch. 14 - (a) Make a line graph of the U.S. civilian labor...Ch. 14 - (a) Plot the voter participation rate. (b)...Ch. 14 - For each of the following fitted trends, make a...Ch. 14 - (a) Make a line graph of consumer credit...Ch. 14 - (a) Plot the data on U.S. general aviation...Ch. 14 - Prob. 17CECh. 14 - (a) Plot either receipts and outlays or federal...Ch. 14 - Prob. 19CECh. 14 - (a) Plot the data on leisure and hospitality...Ch. 14 - Prob. 21CECh. 14 - Prob. 22CECh. 14 - (a) Plot the data on skier/snowboard visits. (b)...Ch. 14 - Prob. 24CECh. 14 - (a) Plot U.S. petroleum imports on a graph. (b)...Ch. 14 - (a) Make a line chart and fit an m-period moving...Ch. 14 - Refer to exercise 14.26. (a) Plot the dollar/pound...Ch. 14 - (a) Plot the data on natural gas bills. (b) Can...Ch. 14 - (a) Plot the data on air travel delays. (b) Can...Ch. 14 - (a) Plot the data on airplane shipments. (b) Can...Ch. 14 - (a) Plot the data on revolving credit (credit...Ch. 14 - The following seasonal regression was fitted with...Ch. 14 - The following seasonal regression was fitted with...
Knowledge Booster


Learn more about
Need a deep-dive on the concept behind this application? Look no further. Learn more about this topic, statistics and related others by exploring similar questions and additional content below.Similar questions
- Harvard University California Institute of Technology Massachusetts Institute of Technology Stanford University Princeton University University of Cambridge University of Oxford University of California, Berkeley Imperial College London Yale University University of California, Los Angeles University of Chicago Johns Hopkins University Cornell University ETH Zurich University of Michigan University of Toronto Columbia University University of Pennsylvania Carnegie Mellon University University of Hong Kong University College London University of Washington Duke University Northwestern University University of Tokyo Georgia Institute of Technology Pohang University of Science and Technology University of California, Santa Barbara University of British Columbia University of North Carolina at Chapel Hill University of California, San Diego University of Illinois at Urbana-Champaign National University of Singapore McGill…arrow_forwardName Harvard University California Institute of Technology Massachusetts Institute of Technology Stanford University Princeton University University of Cambridge University of Oxford University of California, Berkeley Imperial College London Yale University University of California, Los Angeles University of Chicago Johns Hopkins University Cornell University ETH Zurich University of Michigan University of Toronto Columbia University University of Pennsylvania Carnegie Mellon University University of Hong Kong University College London University of Washington Duke University Northwestern University University of Tokyo Georgia Institute of Technology Pohang University of Science and Technology University of California, Santa Barbara University of British Columbia University of North Carolina at Chapel Hill University of California, San Diego University of Illinois at Urbana-Champaign National University of Singapore…arrow_forwardA company found that the daily sales revenue of its flagship product follows a normal distribution with a mean of $4500 and a standard deviation of $450. The company defines a "high-sales day" that is, any day with sales exceeding $4800. please provide a step by step on how to get the answers in excel Q: What percentage of days can the company expect to have "high-sales days" or sales greater than $4800? Q: What is the sales revenue threshold for the bottom 10% of days? (please note that 10% refers to the probability/area under bell curve towards the lower tail of bell curve) Provide answers in the yellow cellsarrow_forward
- Find the critical value for a left-tailed test using the F distribution with a 0.025, degrees of freedom in the numerator=12, and degrees of freedom in the denominator = 50. A portion of the table of critical values of the F-distribution is provided. Click the icon to view the partial table of critical values of the F-distribution. What is the critical value? (Round to two decimal places as needed.)arrow_forwardA retail store manager claims that the average daily sales of the store are $1,500. You aim to test whether the actual average daily sales differ significantly from this claimed value. You can provide your answer by inserting a text box and the answer must include: Null hypothesis, Alternative hypothesis, Show answer (output table/summary table), and Conclusion based on the P value. Showing the calculation is a must. If calculation is missing,so please provide a step by step on the answers Numerical answers in the yellow cellsarrow_forwardShow all workarrow_forward
arrow_back_ios
SEE MORE QUESTIONS
arrow_forward_ios
Recommended textbooks for you
 College AlgebraAlgebraISBN:9781305115545Author:James Stewart, Lothar Redlin, Saleem WatsonPublisher:Cengage Learning

 Trigonometry (MindTap Course List)TrigonometryISBN:9781305652224Author:Charles P. McKeague, Mark D. TurnerPublisher:Cengage Learning
 Glencoe Algebra 1, Student Edition, 9780079039897...AlgebraISBN:9780079039897Author:CarterPublisher:McGraw Hill
 Algebra and Trigonometry (MindTap Course List)AlgebraISBN:9781305071742Author:James Stewart, Lothar Redlin, Saleem WatsonPublisher:Cengage Learning
College Algebra
Algebra
ISBN:9781305115545
Author:James Stewart, Lothar Redlin, Saleem Watson
Publisher:Cengage Learning
Trigonometry (MindTap Course List)
Trigonometry
ISBN:9781305652224
Author:Charles P. McKeague, Mark D. Turner
Publisher:Cengage Learning
Glencoe Algebra 1, Student Edition, 9780079039897...
Algebra
ISBN:9780079039897
Author:Carter
Publisher:McGraw Hill
Algebra and Trigonometry (MindTap Course List)
Algebra
ISBN:9781305071742
Author:James Stewart, Lothar Redlin, Saleem Watson
Publisher:Cengage Learning
Time Series Analysis Theory & Uni-variate Forecasting Techniques; Author: Analytics University;https://www.youtube.com/watch?v=_X5q9FYLGxM;License: Standard YouTube License, CC-BY
Operations management 101: Time-series, forecasting introduction; Author: Brandoz Foltz;https://www.youtube.com/watch?v=EaqZP36ool8;License: Standard YouTube License, CC-BY