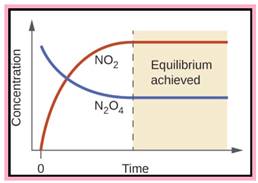
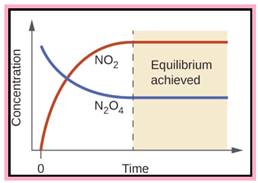
Problem 14.1QP: Consider the reaction N2O4(g)2NO2(g). Draw a graph illustrating the changes of concentrations of... Problem 14.2QP: When 1.0 mol each of H2(g) and I2(g) are mixed at a certain high temperature, they react to give a... Problem 14.3QP Problem 14.4QP: Obtain the equilibrium constant for the reaction HCN(aq)H+(aq)+CN(aq) from the following... Problem 14.5QP: Which of the following reactions involve homogeneous equilibria and which involve heterogeneous... Problem 14.6QP Problem 14.7QP Problem 14.8QP Problem 14.9QP Problem 14.10QP Problem 14.11QP: How is it possible for a catalyst to give products from a reaction mixture that are different from... Problem 14.12QP Problem 14.13QP: A chemist put 1.18 mol of substance A and 2.85 mol of substance B into a 10.0-L flask, which she... Problem 14.14QP: The reaction 3A(g)+B(s)2C(aq)+D(aq) occurs at 25C in a flask, which has 1.87 L available for gas.... Problem 14.15QP: A graduate student places 0.272 mol of PCl3(g) and 8.56 104 mol of PCl5(g) into a 0.718-L flask at... Problem 14.16QP: An experimenter places the following concentrations of gases in a closed container: [NOBr] = 7.13 ... Problem 14.17QP: Chemical Equilibrium I Part 1: You run the chemical reaction C(aq)+D(aq)2E(aq) at 25C. The... Problem 14.18QP: Chemical Equilibrium II Magnesium hydroxide. Mg(OH)2, is a white, partially soluble solid that is... Problem 14.19QP: During an experiment with the Haber process, a researcher put 1 mol N2 and 1 mol H2 into a reaction... Problem 14.20QP: Suppose liquid water and water vapor exist in equilibrium in a closed container. If you add a small... Problem 14.21QP: A mixture initially consisting of 2 mol CO and 2 mol H2 comes to equilibrium with methanol, CH3OH,... Problem 14.22QP Problem 14.23QP: For the reaction 2HI(g)H2(g)+I2(g) carried out at some fixed temperature, the equilibrium constant... Problem 14.24QP: An experimenter introduces 4.0 mol of gas A into a 1.0-L container at 200 K to form product B... Problem 14.25QP: The following reaction is earned out at 500 K in a container equipped with a movable piston.... Problem 14.26QP: For the endothermic reaction AB(g)A(g)+B(g), the following represents a reaction container at two... Problem 14.27QP Problem 14.28QP Problem 14.29QP: A 2.500-mol sample of phosphorus pentachloride, PCl5, decomposes at 160C and 1.00 atm to give 0.338... Problem 14.30QP: You place 4.00 mol of dinitrogen trioxide, N2O3, into a flask, when: it decomposes at 25.0C and 1.00... Problem 14.31QP: You place 0.600 mol of nitrogen, N2, and 1.800 mol of hydrogen, H2, into a reaction vessel at 450C... Problem 14.32QP: Nitrogen monoxide, NO, reacts with bromine, Br2, to give nitrosyl bromide, NOBr.... Problem 14.33QP: In the contact process, sulfuric acid is manufactured by first oxidizing SO2 to SO3, which is then... Problem 14.34QP: Methanol, CH3OH, formerly known as wood alcohol, is manufactured commercially by the following... Problem 14.35QP: Write equilibrium-constant expressions Kc for each of the following reactions. a N2O3(g)NO2(g)+NO(g)... Problem 14.36QP: Write equilibrium-constant expressions Kc for each of the following reactions. a N2H4(g)N2(g)+2H2(g)... Problem 14.37QP: The equilibrium-constant expression for a gas reaction is Kc[H2O]2[SO2]2[H2S]2[O2]3 Write the... Problem 14.38QP Problem 14.39QP: The equilibrium-constant expression for a reaction is Kc[NO2]4[O2][N2O5]2 What is the... Problem 14.40QP Problem 14.41QP: The equilibrium constant Kc, for the equation 2HI(g)H2(g)+I2(g) at 321C is 1.03 What is the value of... Problem 14.42QP: The equilibrium constant Kc for the equation CS2(g)+4H2(g)CH4(g)+2H2S(g) at 900C is 27.8 What is the... Problem 14.43QP: A 13.0-L reaction vessel at 499C contained 0.852mol H2, 0.361 mol I2, and 3.84 mol HI. Assuming that... Problem 14.44QP: A 4.00-L vessel contained 0.0148 mol of phosphorus trichloride, 0.0126 mol of phosphorus... Problem 14.45QP: Obtain the value of Kc for the following reaction at 900 K: 2SO2(g)+O2(g)2SO3(g) Use the data given... Problem 14.46QP: Obtain the value of Kc for the following reaction at 500 K: CO(g)+2H2(g)CH3OH(g) Use the data given... Problem 14.47QP: At 60C, 3.76 mol of nitrosyl bromide, NOBr, placed in a 1.00-L flask dissociates to the extent of... Problem 14.48QP: A 2 00-mol sample of nitrogen dioxide was placed in an 80.0-L vessel. At 200C, the nitrogen dioxide... Problem 14.49QP: Write equilibrium-constant expressions Kp for each of the following reactions: a H2(g)+Br2(g)2HBr(g)... Problem 14.50QP: Write equilibrium-constant expressions Kp for each of the following reactions: a N2O4(g)2NO2(g) b... Problem 14.51QP: The value of Kc for the following reaction at 298C is 41. C(g)A(g)+3B(g) What is Kp at this... Problem 14.52QP: The equilibrium constant Kc equals 0.0952 for the following reaction at 227C. CH3OH(g)CO(g)+2H2(g)... Problem 14.53QP: The reaction SO2(g)+12O2(g)SO3(g) has Kp equal to 6.55 at 627C. What is the value of Kc at this... Problem 14.54QP: Fluorine, F2, dissociates into atoms on heating. 12F2(g)F(g) The value of Kp at 842C is 7.55 102... Problem 14.55QP: Write the expression for the equilibrium constant Kc for each of the following equations: a... Problem 14.56QP: For each of the following equations, give the expression for the equilibrium constant Kc: a... Problem 14.57QP: On the basis of the value of Kc decide whether or not you expect nearly complete reaction at... Problem 14.58QP: Would either of the following reactions go almost completely to product at equilibrium? a... Problem 14.59QP: Hydrogen fluoride decomposes according to the following equation: 2HF(g)H2(g)+F2(g) The value of Kc... Problem 14.60QP: Suppose sulfur dioxide reacts with oxygen at 25C. 2SO2(g)+O2(g)2SO3(g) The equilibrium constant Kc... Problem 14.61QP: The following reaction has an equilibrium constant Kc equal to 4.36 104 at 38C... Problem 14.62QP: The following reaction has an equilibrium constant Kc equal to 3.59 at 900C.... Problem 14.63QP: Methanol, CH3OH, is manufactured industrially by the reaction CO(g)+2H2(g)CH3OH(g) A gaseous mixture... Problem 14.64QP: Sulfur trioxide, used to manufacture sulfuric acid, is obtained commercially from sulfur dioxide.... Problem 14.65QP: Phosgene, COCl2, used in the manufacture of polyurethane plastics, is prepared from CO and Cl2.... Problem 14.66QP: Nitrogen monoxide, NO, is formed in automobile exhaust by the reaction of N2 and O2 (from air).... Problem 14.67QP: Iodine and bromine react to give iodine monobromide, IBr. I2(g)+Br2(g)2IBr(g) What is the... Problem 14.68QP: Initially a mixture contains 0.850 mol each of N2 and O2 in an 8.00-L vessel. Find the composition... Problem 14.69QP: Calculate the composition of the gaseous mixture obtained when 1.25 mol of carbon dioxide is exposed... Problem 14.70QP: The equilibrium constant Kc, for the reaction PCl3(g)+Cl2(g)PCl5(g) equals 49 at 230C. If 0.400 mol... Problem 14.71QP: Suppose 1.000 mol CO and 3.000 mol H2 are put in a 10.00-L vessel at 1200 K. The equilibrium... Problem 14.72QP: The equilibrium constant Kc for the reaction N2(g)+3H2(g)2NH3(g) at 450C is 0.159. Calculate the... Problem 14.73QP: Consider the equilibrium FeO(s)+CO(g)Fe(s)+CO2(g) When carbon dioxide is removed from the... Problem 14.74QP: a Predict the direction of reaction when chlorine gas is added to an equilibrium mixture of PCl3,... Problem 14.75QP: What would you expect to be the effect of an increase of pressure on each of the following... Problem 14.76QP: Indicate whether either an increase or a decrease of pressure obtained by changing the volume would... Problem 14.77QP: Methanol is prepared industrially from synthesis gas (CO and H2). CO(g)+2H2(g)CH3OH(g);H=21.7kcal... Problem 14.78QP: One way of preparing hydrogen is by the decomposition of water. 2H2O(g)2H2(g)+O2(g);H=484kJ Would... Problem 14.79QP: Use thermochemical data (Appendix C) to decide whether the equilibrium constant for the following... Problem 14.80QP: Use thermochemical data (Appendix C) to decide whether the equilibrium constant for the following... Problem 14.81QP: What would you expect to be the general temperature and pressure conditions for an optimum yield of... Problem 14.82QP: Predict the general temperature and pressure conditions for the optimum conversion of ethylene... Problem 14.83QP: A mixture of carbon monoxide, hydrogen, and methanol, CH3OH, is at equilibrium according to the... Problem 14.84QP Problem 14.85QP: At 850C and 1.000 atm pressure, a gaseous mixture of carbon monoxide and carbon dioxide in... Problem 14.86QP: An equilibrium mixture of dinitrogen tetroxide, N2O4, and nitrogen dioxide, NO2, is 65.8% NO2 by... Problem 14.87QP: A 2.50-L vessel contains 1.75 mol N2, 1.75 mol H2, and 0.346 mol NH3. What is the direction of... Problem 14.88QP: A vessel originally contained 0.0200 mol iodine monobromide (IBr), 0.050 mol I2, and 0.050 mol Br2.... Problem 14.89QP: A gaseous mixture containing 1.00 mol each of CO, H2O, CO2, and H2 is exposed to a zinc oxide copper... Problem 14.90QP: A 2.0-L reaction flask initially contains 0.010 mol CO, 0.80 mol H2, and 0.50 mol CH3OH (methanol).... Problem 14.91QP: Hydrogen bromide decomposes when heated according to the equation 2HBr(g)H2(g)+Br2(g) The... Problem 14.92QP: Iodine monobromide, IBr, occurs as brownish-black crystals that vaporize with decomposition:... Problem 14.93QP: Phosgene, COCl2, is a toxic gas used in the manufacture of urethane plastics. The gas dissociates at... Problem 14.94QP: Dinitrogen tetroxide, N2O4, is a colorless gas (boiling point, 21C), which dissociates to give... Problem 14.95QP Problem 14.96QP Problem 14.97QP: The amount of nitrogen dioxide formed by dissociation of dinitrogen tetroxide, N2O4(g)2NO2(g)... Problem 14.98QP: The equilibrium constant Kc for the synthesis of methanol, CH3OH. CO(g)+2H2(g)CH3OH(g) is 4.3 at... Problem 14.99QP: For the reaction N2(g)+3H2(g)2NH3(g) show that Kc = Kp(RT)2 Do not use the formula Kp = Kc(RT)5n... Problem 14.100QP Problem 14.101QP: At high temperatures, a dynamic equilibrium exists between carbon monoxide, carbon dioxide, and... Problem 14.102QP: At high temperatures, a dynamic equilibrium exists between carbon monoxide, carbon dioxide, and... Problem 14.103QP: The equilibrium constant Kc for the reaction PCl3(g)+Cl2(g)PCl3(g) equals 4.1 at 300C. a A sample of... Problem 14.104QP: At 25C in a closed system, ammonium hydrogen sulfide exists as the following equilibrium:... Problem 14.105QP: At moderately high temperatures, SbCl5 decomposes into SbCl3 and Cl2 as follows:... Problem 14.106QP: The following reaction is important in the manufacture of sulfuric acid. SO2(g)+12O2(g)SO3(g) At 900... Problem 14.107QP: Sulfuryl chloride is used in organic chemistry as a chlorinating agent. At moderately high... Problem 14.108QP: Phosgene was used as a poisonous gas in World War I. At high temperatures it decomposes as follows:... Problem 14.109QP: Gaseous acetic acid molecules have a certain tendency to form dimers. (A dimer is a molecule formed... Problem 14.110QP: Gaseous acetic acid molecules have a certain tendency to form dimers. (A dimer is a molecules formed... Problem 14.111QP: When 0.112 mol of NO and 18.22 g of bromine are placed in a 1.00-L reaction vessel and sealed, the... Problem 14.112QP Problem 14.113QP Problem 14.114QP Problem 14.115QP: A chemist placed a mixture of CO2(g) and CF4(g) into a flask at a particular temperature. These... Problem 14.116QP Problem 14.117QP Problem 14.118QP: The equilibrium constant Kc for the equation 2HI(g)H2(g)+I2(g) is 1.84 at 425C. The equilibrium... Problem 14.119QP: Consider the reaction N2O4(g)2NO2(g). Would you expect this reaction to be endothermic or... Problem 14.120QP: A researcher put 0.400 mol PCl3 and 0.600 mol Cl2 into a 5.00-L vessel at a given temperature to... Problem 14.121QP: Ammonium hydrogen sulfide. NH4HS, is unstable at room temperature and decomposes:... Problem 14.122QP: A chemist wants to prepare phosgene, COCl2, by the following reaction: CO(g)+Cl2(g)COCl2(g) He... Problem 14.123QP Problem 14.124QP Problem 14.125QP Problem 14.126QP: A container with a volume of 1.500 L was evacuated and then filled at low temperature with 0.0500... Problem 14.127QP Problem 14.128QP Problem 14.129QP Problem 14.130QP: Sulfur dioxide reacts with oxygen to produce sulfur trioxide in the presence of a catalyst:... Problem 14.131QP: Molecular bromine, Br2, dissociates at elevated temperatures into bromine atoms, Br. Br2(g)2Br(g) A... Problem 14.132QP: Consider the production of ammonia from its elements: N2(g)+3H2(g)2NH3(g) In a pilot experiment, a... Problem 14.133QP: A mixture of 0.0565 mol phosphorus pentachloride, PCl5, and 0.0800 mol helium gas, He, was placed in... Problem 14.134QP: Calcium carbonate, CaCO3, decomposes when heated to give calcium oxide. CaO, and carbon dioxide,... Problem 14.135QP: The following equilibrium was studied by analyzing the equilibrium mixture for the amount of H2S... Problem 14.136QP Problem 14.137QP: Phosphorus pentachloride, PCl5, decomposes on heating to give phosphorus trichloride, PCl5, and... Problem 14.138QP: Antimony(V) chloride. SbCl5, decomposes on heating to give antimony(III) chloride, SbCl3, and... format_list_bulleted


 Chemistry: The Molecular ScienceChemistryISBN:9781285199047Author:John W. Moore, Conrad L. StanitskiPublisher:Cengage Learning
 ChemistryChemistryISBN:9781305957404Author:Steven S. Zumdahl, Susan A. Zumdahl, Donald J. DeCostePublisher:Cengage Learning
 Chemistry: An Atoms First ApproachChemistryISBN:9781305079243Author:Steven S. Zumdahl, Susan A. ZumdahlPublisher:Cengage Learning
 Chemistry for Engineering StudentsChemistryISBN:9781337398909Author:Lawrence S. Brown, Tom HolmePublisher:Cengage Learning
 World of Chemistry, 3rd editionChemistryISBN:9781133109655Author:Steven S. Zumdahl, Susan L. Zumdahl, Donald J. DeCostePublisher:Brooks / Cole / Cengage Learning


