
Pearson eText Introductory Statistics: Exploring the World Through Data -- Instant Access (Pearson+)
3rd Edition
ISBN: 9780136880882
Author: Robert Gould, Rebecca Wong
Publisher: PEARSON+
expand_more
expand_more
format_list_bulleted
Concept explainers
Videos
Textbook Question
Chapter 14, Problem 13SE
Wages of Twins Figure A shows a
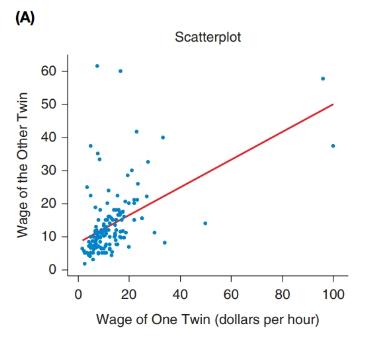
Expert Solution & Answer
Want to see the full answer?
Check out a sample textbook solution
Students have asked these similar questions
A public health researcher is studying the impacts of nudge marketing techniques on shoppers vegetables
The director of admissions at Kinzua University in Nova Scotia estimated the distribution of student admissions for the fall semester on the basis of past experience.
Admissions
Probability
1,100
0.5
1,400
0.4
1,300
0.1
Click here for the Excel Data File
Required:
What is the expected number of admissions for the fall semester?
Compute the variance and the standard deviation of the number of admissions.
Note: Round your standard deviation to 2 decimal places.
A pollster randomly selected four of 10 available people.
Required:
How many different groups of 4 are possible?
What is the probability that a person is a member of a group?
Note: Round your answer to 3 decimal places.
Chapter 14 Solutions
Pearson eText Introductory Statistics: Exploring the World Through Data -- Instant Access (Pearson+)
Ch. 14 - Predicting Test Scores A professor tells his class...Ch. 14 - Used-Car Values A student wishes to buy a used...Ch. 14 - Height and Age (Example 1) A doctor says he can...Ch. 14 - Units and Semesters The registrar at a small...Ch. 14 - Prob. 5SECh. 14 - Prob. 6SECh. 14 - Prob. 7SECh. 14 - Prob. 8SECh. 14 - Semesters and Credits (Example 4) Figure A shows a...Ch. 14 - Prob. 10SE
Ch. 14 - Salaries Figure A shows a scatterplot of the...Ch. 14 - Prob. 12SECh. 14 - Wages of Twins Figure A shows a scatterplot of...Ch. 14 - Simulated Data Figure A shows a scatterplot of...Ch. 14 - Prob. 15SECh. 14 - Movie Budgets Do movies with bigger budgets tend...Ch. 14 - Education of Parents (Example 7) Each of 29...Ch. 14 - Education of Parents Refer to exercise 14.17 and...Ch. 14 - Student and Parent Heights A random sample of 29...Ch. 14 - Trash The weight of trash (in pounds) produced by...Ch. 14 - Prob. 21SECh. 14 - Prob. 22SECh. 14 - Trash and Confidence Intervals The output provided...Ch. 14 - Movie Budgets In exercise 14.16 you examined the...Ch. 14 - Predicted GPA A student who has been accepted by...Ch. 14 - Used BMWs A used-car dealer is purchasing 50 used...Ch. 14 - Predicted Height (Example 9) A mother wants to...Ch. 14 - Predicted GPA A dean of students at a college...Ch. 14 - Loggers A logging company has the diameter of each...Ch. 14 - Prob. 30SECh. 14 - House Prices (Example 10) Figure A contains the...Ch. 14 - Math SAT Score and GPA Figure A shows information...Ch. 14 - Height and Weight A scatterplot of the heights and...Ch. 14 - Waist Size and Weight A scatterplot of the waist...Ch. 14 - GPA and SAT The figure shows 95#37; prediction...Ch. 14 - Shoes and Heights The scatterplot shows shoe size...Ch. 14 - Height and Weight A scatterplot of the heights and...Ch. 14 - Waist Size and Weight A scatterplot of the waist...Ch. 14 - Baseball Players Figure A shows a scatterplot with...Ch. 14 - Predicting Education Figure A shows a scatterplot...Ch. 14 - Life Expectancy and Gestation Periods for Animals...Ch. 14 - Prob. 42CRE
Additional Math Textbook Solutions
Find more solutions based on key concepts
For Exercises 13–18, write the negation of the statement.
13. The cell phone is out of juice.
Math in Our World
The largest polynomial that divides evenly into a list of polynomials is called the _______.
Elementary & Intermediate Algebra
For Problems 23-28, write in simpler form, as in Example 4. logbFG
Finite Mathematics for Business, Economics, Life Sciences and Social Sciences
1. How is a sample related to a population?
Elementary Statistics: Picturing the World (7th Edition)
Use the ideas in drawings a and b to find the solution to Gausss Problem for the sum 1+2+3+...+n. Explain your ...
A Problem Solving Approach To Mathematics For Elementary School Teachers (13th Edition)
Knowledge Booster


Learn more about
Need a deep-dive on the concept behind this application? Look no further. Learn more about this topic, statistics and related others by exploring similar questions and additional content below.Similar questions
- Wind Mountain is an archaeological study area located in southwestern New Mexico. Potsherds are broken pieces of prehistoric Native American clay vessels. One type of painted ceramic vessel is called Mimbres classic black-on-white. At three different sites the number of such sherds was counted in local dwelling excavations. Test given. Site I Site II Site III 63 19 60 43 34 21 23 49 51 48 11 15 16 46 26 20 31 Find .arrow_forwardRothamsted Experimental Station (England) has studied wheat production since 1852. Each year many small plots of equal size but different soil/fertilizer conditions are planted with wheat. At the end of the growing season, the yield (in pounds) of the wheat on the plot is measured. Suppose for a random sample of years, one plot gave the following annual wheat production (in pounds): 4.46 4.21 4.40 4.81 2.81 2.90 4.93 3.54 4.16 4.48 3.26 4.74 4.97 4.02 4.91 2.59 Use a calculator to verify that the sample variance for this plot is . Another random sample of years for a second plot gave the following annual wheat production (in pounds): 3.89 3.81 3.95 4.07 4.01 3.73 4.02 3.78 3.72 3.96 3.62 3.76 4.02 3.73 3.94 4.03 Use a calculator to verify that the sample variance for this plot is . Suppose that we test the claim using that the population variance of annual wheat production for the first plot is larger…arrow_forwardIt is thought that prehistoric Native Americans did not take their best tools, pottery, and household items when they visited higher elevations for their summer camps. It is hypothesized that archaeological sites tend to lose their cultural identity and specific cultural affiliation as the elevation of the site increases. Let x be the elevation (in thousands of feet) for an archaeological site in the southwestern United States. Let y be the percentage of unidentified artifacts (no specific cultural affiliation) at a given elevation. Suppose that the following data were obtained for a collection of archaeological sites in New Mexico: x 5.50 6.00 6.75 7.00 7.75 y 37 38 92 70 99 Find the equation of the least squares line . Round a and b to three decimal places.arrow_forward
- A fitness trainer wants to estimate the effect of fitness activities on muscle mass for different weight categories of club members. They choose the most popular fitness classes at the gym: yoga, circuit training, and high-intensity interval training (HIIT). Suppose that the weights of club members are separated into three levels: under 155 pounds, 155 – 200 pounds, and over 200 pounds. Draw a flow chart showing the design of this experiment.arrow_forwardThe systolic blood pressure of individuals is thought to be related to both age and weight. Let the systolic blood pressure, age, and weight be represented by the variables x1, x2, and x3, respectively. Suppose that Minitab was used to generate the following descriptive statistics, correlations, and regression analysis for a random sample of 15 individuals. Descriptive Statistics Variable N Mean Median TrMean StDev SE Mean x 1 15 154.14 154.34 154.14 3.842 0.992000 x 2 15 59.69 60.19 59.69 1.462 0.377487 x 3 15 205.55 204.75 205.55 4.558 1.176871 Variable Minimum Maximum Q1 Q3 x 1 125 178 141.803 167.244 x 2 41 80 47.754 78.415 x 3 126 240 140.395 224.008 Correlations (Pearson) x 1 x 2 x 2 0.892 x 3 0.839 0.567 Regression Analysis The regression equation is x 1 = 0.883 + 1.257x2 + 0.871x3 Predictor Coef StDev T P Constant 0.883 0.635 1.39 0.095 x 2 1.257 0.635 1.98 0.036 x 3 0.871 0.419 2.08 0.030 S = 0.428 R-sq = 92.7 %…arrow_forwardAccording to health professionals, a person’s weight is expected to increase with age. To examine that statement, a nutritionist collected data from 11 random females from different age categories between the ages of 21 and 43. In the following table, x is the age of a person and y is the weight in pounds. x, age 21 24 27 29 31 33 35 38 40 42 43 y, weight in lb 121.4 122.3 130.3 131.7 133.3 134.6 136.7 138.4 140.3 142.0 145.1 Select the correct graph of the least-squares line on a scatter diagram.arrow_forward
- Let x be a random variable that represents the percentage of successful free throws a professional basketball player makes in a season. Let y be a random variable that represents the percentage of successful field goals a professional basketball player makes in a season. A random sample of n = 6 professional basketball players gave the following information. x 82 69 73 84 74 64 y 42 48 46 46 46 42 Verify that ∑x =446, ∑y =270, ∑x2 =33,442, ∑y2 =12,180, ∑xy =20,070, and r = 0, and find the critical value for a test using a 5% level of significance claiming that ρis not equal than zero. Round your answer to three decimal places.arrow_forwardLet x be a random variable that represents the percentage of successful free throws a professional basketball player makes in a season. Let y be a random variable that represents the percentage of successful field goals a professional basketball player makes in a season. A random sample of n = 6 professional basketball players gave the following information. x 75 72 75 81 74 81 y 46 39 42 47 49 50 Verify that Se ࣈ 3.591,a ࣈ –10.145, bࣈ0.729, and , and find the predicted percentage of successful field goals for a player with x= 88%successful free throws. Round your answer to the nearest tenth of a percentarrow_forwardAn editor wants to analyze if there is a significant difference in the ratings of books in four different genres. Random samples of book ratings were collected for four different genres. The editor recorded ratings in a 0 to 10 scale in the following table. Fiction Novel Biography Science&Technology 8.5 8.4 6.2 9.1 5.3 5.3 5.5 4.3 7.7 4.2 7.0 9.7 5.1 9.8 9.3 5.2 6.9 8.6 6.7 7.9 4.8 7.1 6.9 8.4 Shall we reject or not reject the claim that there are no differences among the population means of book ratings for the different genres? Use.arrow_forward
- Peggy conducted a study to identify the randomness of rainy days in fall. For 15 days, she recorded whether it rained that day or not. They denoted a rainy day with the letter R, a day without rain with the letter N. R N N R R N N R R N N R R R R Test the sequence for randomness. Use .arrow_forwardConsider the grades for the math and history exams for 10 students on a scale from 0 to 12 in the following table. Student Math History 1 4 8 2 5 9 3 7 9 4 12 10 5 10 8 6 8 5 7 9 6 8 9 6 9 11 9 10 7 10 Compute the Spearman correlation coefficient. Round your answer to three decimal places.arrow_forwardTo compare two elementary schools regarding teaching of reading skills, 12 sets of identical twins were used. In each case, one child was selected at random and sent to school A, and his or her twin was sent to school B. Near the end of fifth grade, an achievement test was given to each child. The results follow: Twin Pair 1 2 3 4 5 6 School A 169 157 115 99 119 113 School B 123 157 112 99 121 122 Twin Pair 7 8 9 10 11 12 School A 120 121 124 145 138 117 School B 153 90 124 140 142 102 Suppose a sign test for matched pairs with a 1% level of significance is used to test the hypothesis that the schools have the same effectiveness in teaching reading skills against the alternate hypothesis that the schools have different levels of effectiveness in teaching reading skills. Let p denote portion of positive signs when the scores of school B are subtracted from the corresponding scores of school…arrow_forward
arrow_back_ios
SEE MORE QUESTIONS
arrow_forward_ios
Recommended textbooks for you
 Functions and Change: A Modeling Approach to Coll...AlgebraISBN:9781337111348Author:Bruce Crauder, Benny Evans, Alan NoellPublisher:Cengage Learning
 Algebra and Trigonometry (MindTap Course List)AlgebraISBN:9781305071742Author:James Stewart, Lothar Redlin, Saleem WatsonPublisher:Cengage Learning
 Glencoe Algebra 1, Student Edition, 9780079039897...AlgebraISBN:9780079039897Author:CarterPublisher:McGraw Hill
 College AlgebraAlgebraISBN:9781305115545Author:James Stewart, Lothar Redlin, Saleem WatsonPublisher:Cengage Learning
 Big Ideas Math A Bridge To Success Algebra 1: Stu...AlgebraISBN:9781680331141Author:HOUGHTON MIFFLIN HARCOURTPublisher:Houghton Mifflin Harcourt
Functions and Change: A Modeling Approach to Coll...
Algebra
ISBN:9781337111348
Author:Bruce Crauder, Benny Evans, Alan Noell
Publisher:Cengage Learning
Algebra and Trigonometry (MindTap Course List)
Algebra
ISBN:9781305071742
Author:James Stewart, Lothar Redlin, Saleem Watson
Publisher:Cengage Learning
Glencoe Algebra 1, Student Edition, 9780079039897...
Algebra
ISBN:9780079039897
Author:Carter
Publisher:McGraw Hill
College Algebra
Algebra
ISBN:9781305115545
Author:James Stewart, Lothar Redlin, Saleem Watson
Publisher:Cengage Learning
Big Ideas Math A Bridge To Success Algebra 1: Stu...
Algebra
ISBN:9781680331141
Author:HOUGHTON MIFFLIN HARCOURT
Publisher:Houghton Mifflin Harcourt
Correlation Vs Regression: Difference Between them with definition & Comparison Chart; Author: Key Differences;https://www.youtube.com/watch?v=Ou2QGSJVd0U;License: Standard YouTube License, CC-BY
Correlation and Regression: Concepts with Illustrative examples; Author: LEARN & APPLY : Lean and Six Sigma;https://www.youtube.com/watch?v=xTpHD5WLuoA;License: Standard YouTube License, CC-BY