Videos
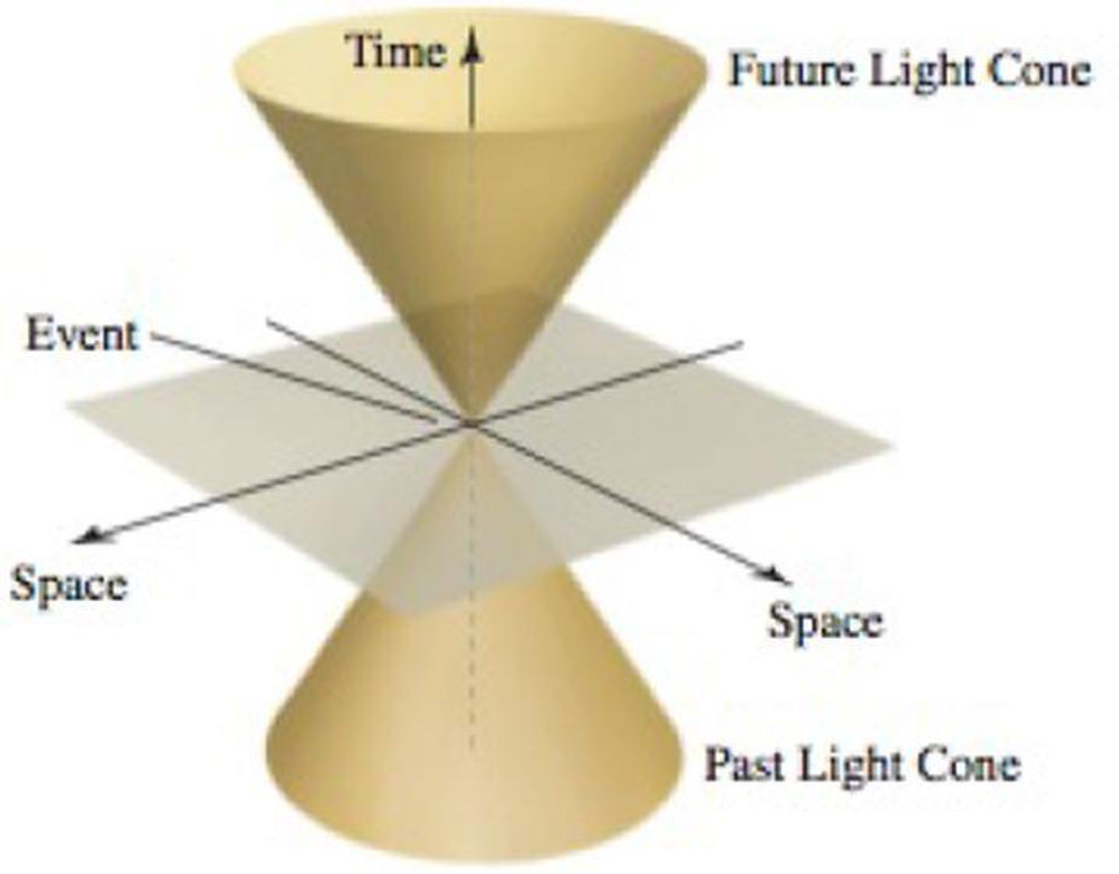
Light cones The idea of a light cone appears in the Special Theory of Relativity. The xy-plane (see figure) represents all of three-dimensional space, and the z-axis is the time axis (t-axis). If an event E occurs at the origin, the interior of the future light cone (t > 0) represents all events in the future that could be affected by E, assuming that no signal travels faster than the speed of light. The interior of the past light cone (t < 0) represents all events in the past that could have affected E, again assuming that no signal travels faster than the speed of light.
a. If time is measured in seconds and distance (x and y) is measured in light-seconds (the distance light travels in 1 s), the light cone makes a 45° angle with the .xy-plane. Write the equation of the light cone in this case.
b. Suppose distance is measured in meters and time is measured in seconds. Write the equation of the light cone in this case given that the speed of light is 3 × 10⁸ m/s.
Want to see the full answer?
Check out a sample textbook solution
Chapter 13 Solutions
CALCULUS:EARLY TRANSCENDENTALS-PACKAGE
Additional Math Textbook Solutions
Algebra and Trigonometry (6th Edition)
Elementary Statistics: Picturing the World (7th Edition)
Elementary Statistics (13th Edition)
Elementary Statistics
A First Course in Probability (10th Edition)
College Algebra with Modeling & Visualization (5th Edition)


- Solve please and thanks!arrow_forwardThe graph of the function f in the figure below consists of line segments and a semicircle. Let g be the function given by x 9(x) = * f(t)dt. Determine all values of r, if any, where g has a relative minimum on the open interval (-9, 9). y 8 7 6 5 4 32 1 Graph of f x -10 -9 -8 -7 -6 -5 -4 -3 -2 -1 1 2 3 4 5 6 7 8 9 10 -1 -2 -3 -4 -5 -6 678 -7 -8arrow_forwardSolve pleasearrow_forward
- A particle moves along the x-axis for 0 < t < 18 such that its velocity is given by the graph shown below. Find the total distance traveled by the particle during the time interval 4 ≤ t ≤ 8. 8 y 7 6 5 4 32 1 6 7 -1 1 2 3 4 5 -1 -2 -3 -4 56 -6 -8 8 00 Graph of v(t) x 9 10 11 12 13 14 15 16 17 18 19arrow_forwardUsing the Chain rule please and thank youarrow_forward10. [-/3 Points] DETAILS MY NOTES SESSCALCET2 7.2.047. Consider the following. aR- br (a) Set up an integral for the volume a solid torus (the donut-shaped solid shown in the figure) with radii br and aR. (Let a 8 and b = 2.) = dy (b) By interpreting the integral as an area, find the volume V of the torus. V = Need Help? Read It Watch Itarrow_forward
- Graph y= log(x − 1) +4 10+ 9 8 7 6 5 4 32 1 10 -9 -8 -7 -6 -5 -4 -3 -2 -1 1 2 3 4 5 -1 6 7 8 9 10 -2 -3 -4 -5 -6 -7 -8 -9 -10arrow_forwardWrite an equation for the graph shown below. 5 4 3 2 1 -5-4-3-2-1 -1 1 2 3 4 5 f(x) = -2 -3 -4 -5arrow_forward1. We want to graph the function f(x) log4 x. In a table below, = find at three points with nice integer y-values (no rounding!) and then graph the function at right. Be sure to clearly indicate any asymptotes. (4 points) 3 2 1- -1 0 1 2 3 4 5 10 X log4(x) -1 -2 -3- 6 7 8 00arrow_forward
 Algebra & Trigonometry with Analytic GeometryAlgebraISBN:9781133382119Author:SwokowskiPublisher:Cengage
 Algebra: Structure And Method, Book 1AlgebraISBN:9780395977224Author:Richard G. Brown, Mary P. Dolciani, Robert H. Sorgenfrey, William L. ColePublisher:McDougal Littell
 Elementary Linear Algebra (MindTap Course List)AlgebraISBN:9781305658004Author:Ron LarsonPublisher:Cengage Learning
 Mathematics For Machine TechnologyAdvanced MathISBN:9781337798310Author:Peterson, John.Publisher:Cengage Learning,