Bundle: Organic Chemistry, 9th, Loose-Leaf + OWLv2, 4 terms (24 months) Printed Access Card
9th Edition
ISBN: 9781305701021
Author: John E. McMurry
Publisher: Cengage Learning
expand_more
expand_more
format_list_bulleted
Concept explainers
Textbook Question
Chapter 13.5, Problem 8P
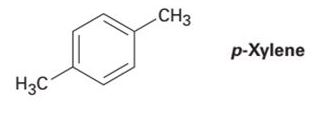
How many peaks would you expect in the 1H NMR spectrum of 1, 4-dimethyl- benzene (para-xylene, or p-xylene)? What ratio of peak areas would you expect on integration of the spectrum? Refer to Table 13-3 for approximate chemical shifts, and sketch what the spectrum would look like. (Remember from
Section 2-4
that

Expert Solution & Answer
Trending nowThis is a popular solution!

Students have asked these similar questions
QUESTION: Find the standard deviation for the 4 different groups
5.298
3.977
223.4
148.7
5.38
4.24
353.7
278.2
5.033
4.044
334.6
268.7
4.706
3.621
305.6
234.4
4.816
3.728
340.0
262.7
4.828
4.496
304.3
283.2
4.993
3.865
244.7
143.6
STDEV =
STDEV =
STDEV =
STDEV =
QUESTION: Fill in the answers in the empty green boxes regarding 'Question 5: Calculating standard error of regression'
*The images of the data showing 'coefficients for the standard curve' have been provided
Using the Nernst equation to calculate nonstandard cell voltage
Try Again
Your answer is wrong. In addition to checking your math, check that you used the right data and DID NOT round any intermediate calculations.
A galvanic cell at a temperature of 25.0 °C is powered by the following redox reaction:
2+
2+
Sn²+ Ba(s)
(aq) + Ba (s) Sn (s) + Ba²+ (aq)
→>>
Suppose the cell is prepared with 6.10 M Sn
2+
2+
in one half-cell and 6.62 M Ba
in the other.
Calculate the cell voltage under these conditions. Round your answer to 3 significant digits.
1.71 V
☐ x10
☑
5
0/5
?
00.
18
Ar
Chapter 13 Solutions
Bundle: Organic Chemistry, 9th, Loose-Leaf + OWLv2, 4 terms (24 months) Printed Access Card
Ch. 13.1 - Prob. 1PCh. 13.1 - Prob. 2PCh. 13.2 - Prob. 3PCh. 13.3 - The following 1H NMR peaks were recorded on a...Ch. 13.3 - When the 1Η NMR spectrum of acetone, CH3COCH3, is...Ch. 13.4 - Each of the following compounds has a single 1H...Ch. 13.4 - Identify the different types of protons in the...Ch. 13.5 - How many peaks would you expect in the 1H NMR...Ch. 13.6 - Predict the splitting patterns you would expect...Ch. 13.6 - Draw structures for compounds that meet the...
Ch. 13.6 - The integrated 1H NMR spectrum of a compound of...Ch. 13.7 - Identify the indicated sets of protons as...Ch. 13.7 - How many kinds of electronically nonequivalent...Ch. 13.7 - How many absorptions would you expect (S)-malate,...Ch. 13.8 - 3-Bromo-1-phenyl-1-propene shows a complex NMR...Ch. 13.9 - How could you use 1H NMR to determine the...Ch. 13.11 - Prob. 17PCh. 13.11 - Propose structures for compounds that fit the...Ch. 13.11 - Prob. 19PCh. 13.12 - Prob. 20PCh. 13.12 - Prob. 21PCh. 13.12 - Prob. 22PCh. 13.13 - Prob. 23PCh. 13.SE - Into how many peaks would you expect the 1H NMR...Ch. 13.SE - How many absorptions would you expect the...Ch. 13.SE - Sketch what you might expect the 1H and 13C NMR...Ch. 13.SE - How many electronically nonequivalent kinds of...Ch. 13.SE - Identify the indicated protons in the following...Ch. 13.SE - Prob. 29APCh. 13.SE - Prob. 30APCh. 13.SE - When measured on a spectrometer operating at 200...Ch. 13.SE - Prob. 32APCh. 13.SE - Prob. 33APCh. 13.SE - How many types of nonequivalent protons are...Ch. 13.SE - The following compounds all show a single line in...Ch. 13.SE - Prob. 36APCh. 13.SE - Propose structures for compounds with the...Ch. 13.SE - Predict the splitting pattern for each kind of...Ch. 13.SE - Predict the splitting pattern for each kind of...Ch. 13.SE - Identify the indicated sets of protons as...Ch. 13.SE - Identify the indicated sets of protons as...Ch. 13.SE - The acid-catalyzed dehydration of...Ch. 13.SE - How could you use 1H NMR to distinguish between...Ch. 13.SE - Propose structures for compounds that fit the...Ch. 13.SE - Propose structures for the two compounds whose 1H...Ch. 13.SE - Prob. 46APCh. 13.SE - How many absorptions would you expect to observe...Ch. 13.SE - Prob. 48APCh. 13.SE - How could you use 1H and 13C NMR to help...Ch. 13.SE - How could you use 1H NMR, 13C NMR, and IR...Ch. 13.SE - Assign as many resonances as you can to specific...Ch. 13.SE - Assume that you have a compound with the formula...Ch. 13.SE - The compound whose 1H NMR spectrum is shown has...Ch. 13.SE - The compound whose 1H NMR spectrum is shown has...Ch. 13.SE - Propose structures for compounds that fit the...Ch. 13.SE - Long-range coupling between protons more than two...Ch. 13.SE - The 1H and 13C NMR spectra of compound A, C8H9Br,...Ch. 13.SE - Propose structures for the three compounds whose...Ch. 13.SE - The mass spectrum and 13C NMR spectrum of a...Ch. 13.SE - Compound A, a hydrocarbon with M+=96 in its mass...Ch. 13.SE - Propose a structure for compound C, which has...Ch. 13.SE - Prob. 62GPCh. 13.SE - Propose a structure for compound E, C7H12O2, which...Ch. 13.SE - Compound F, a hydrocarbon with M+=96 in its mass...Ch. 13.SE - 3-Methyl-2-butanol has five signals in its 13C NMR...Ch. 13.SE - A 13C NMR spectrum of commercially available...Ch. 13.SE - Carboxylic acids (RCO2H) react with alcohols (ROH)...Ch. 13.SE - Prob. 68GPCh. 13.SE - The proton NMR spectrum is shown for a compound...Ch. 13.SE - The proton NMR spectrum of a compound with the...Ch. 13.SE - The proton NMR spectrum is shown for a compound...
Knowledge Booster
Learn more about
Need a deep-dive on the concept behind this application? Look no further. Learn more about this topic, chemistry and related others by exploring similar questions and additional content below.Similar questions
- Question: Find both the b (gradient) and a (y-intercept) value from the list of data below: (x1 -x̄) 370.5 (y1 - ȳ) 5.240 (x2 - x̄) 142.5 (y2 - ȳ) 2.004 (x3 - x̄) 28.5 (y3 - ȳ) 0.390 (x4 - x̄) -85.5 (y4 - ȳ) -1.231 (x5 - x̄) -199.5 (y5 - ȳ) -2.829 (x6 - x̄) -256.5 (y6 - ȳ) -3.575arrow_forwardCalculating standard reaction free energy from standard reduction... Using standard reduction potentials from the ALEKS Data tab, calculate the standard reaction free energy AG° for the following redox reaction. Be sure your answer has the correct number of significant digits. 3Cu+ (aq) + Cro²¯ (aq) +4H₂O (1) → 3Cu²+ (aq) +Cr(OH)3 (s)+5OH˜¯ (aq) 0 kJ ☐ x10 00. 18 Ararrow_forwardCalculating the pH of a weak base titrated with a strong acid An analytical chemist is titrating 241.7 mL of a 0.4900M solution of methylamine (CH3NH2) with a 0.7800M solution of HNO3. The pK of methylamine is 3.36. Calculate the pH of the base solution after the chemist has added 17.7 mL of the HNO3 solution to it. Note for advanced students: you may assume the final volume equals the initial volume of the solution plus the volume of HNO3 solution added. Round your answer to 2 decimal places. pH = ☑ ? 18 Ararrow_forward
- The following is two groups (Regular tomato sauce & Salt Reduced Tomato Sauce) of data recorded by a team analysising salt content in tomato sauce using the MOHR titration method: Regular Tomato Sauce Salt Reduced Tomato Sauce 223.4 148.7 353.7 278.2 334.6 268.7 305.6 234.4 340.0 262.7 304.3 283.2 244.7 143.6 QUESTION: For both groups of data calculate the answers attached in the image.arrow_forwardThe following is a two groups (Regular tomato sauce & Salt Reduced Tomato Sauce) of data recorded by a team analysising salt content in tomato sauce using the MOHR titration method: Regular Tomato Sauce Salt Reduced Tomato Sauce 340.0mmol/L 262.7mmol/L QUESTION: For both groups (Regular & Salt Reduced tomato sauce) of data provide answers to the following calculations below: 1. Standard Deviation (Sx) 2. T Values (t0.05,4) 3. 95% Confidence Interval (mmol/L) 4. [Na+] (mg/100 mL) 5. 95% Confidence Interval (mg/100 mL)arrow_forwardIf we have leucine (2-amino-4-methylpentanoic acid), alanine (2-aminopropanoic acid) and phenylalanine (2-amino-3-phenylpropanoic acid), indicate the tripeptides that can be formed (use the abbreviated symbols Leu., Ala and Phe).arrow_forward
- Briefly state why trifluoroacetic acid is more acidic than acetic acid.arrow_forwardExplain why acid chlorides are more reactive than amides in reactions with nucleophiles.arrow_forwardCalculating the pH of a weak base titrated with a strong acid An analytical chemist is titrating 101.7 mL of a 0.3500M solution of piperidine (C5H10NH) with a 0.05700M solution of HClO4. The pK of piperidine is 2.89. Calculate the pH of the base solution after the chemist has added 682.9 mL of the HClO solution to it. 4 Note for advanced students: you may assume the final volume equals the initial volume of the solution plus the volume of HClO solution added. 4 Round your answer to 2 decimal places. pH = .11 00. 18 Ararrow_forward
- The following is a two groups (Regular tomato sauce & Salt Reduced Tomato Sauce) of data recorded by a team analysising salt content in tomato sauce using the MOHR titration method: Regular Tomato Sauce Salt Reduced Tomato Sauce 340.0 262.7 QUESTION: For both groups of data provide answers to the calculations attached in the imagearrow_forward7. Concentration and uncertainty in the estimate of concentration (class data) Class mean for sample (Regular) |[Cl-] (mmol/L) class mean Sn za/2 95% Confidence Interval (mmol/L) [Na+] (mg/100 mL) 95% Confidence Interval (mg/100 mL)arrow_forwardThe following is a two groups (Regular tomato sauce & Salt Reduced Tomato Sauce) of data recorded by a team analysising salt content in tomato sauce using the MOHR titration method: Regular Tomato Sauce Salt Reduced Tomato Sauce 223.4 148.7 353.7 278.2 334.6 268.7 305.6 234.4 340.0 262.7 304.3 283.2 244.7 143.6 QUESTION: For both groups of data calculate the answers attached in the image.arrow_forward
arrow_back_ios
SEE MORE QUESTIONS
arrow_forward_ios
Recommended textbooks for you

 Organic Chemistry: A Guided InquiryChemistryISBN:9780618974122Author:Andrei StraumanisPublisher:Cengage Learning
 Macroscale and Microscale Organic ExperimentsChemistryISBN:9781305577190Author:Kenneth L. Williamson, Katherine M. MastersPublisher:Brooks Cole
 Principles of Instrumental AnalysisChemistryISBN:9781305577213Author:Douglas A. Skoog, F. James Holler, Stanley R. CrouchPublisher:Cengage Learning


Organic Chemistry: A Guided Inquiry
Chemistry
ISBN:9780618974122
Author:Andrei Straumanis
Publisher:Cengage Learning

Macroscale and Microscale Organic Experiments
Chemistry
ISBN:9781305577190
Author:Kenneth L. Williamson, Katherine M. Masters
Publisher:Brooks Cole

Principles of Instrumental Analysis
Chemistry
ISBN:9781305577213
Author:Douglas A. Skoog, F. James Holler, Stanley R. Crouch
Publisher:Cengage Learning
NMR Spectroscopy; Author: Professor Dave Explains;https://www.youtube.com/watch?v=SBir5wUS3Bo;License: Standard YouTube License, CC-BY